
| Filed by the Registrant | x | |
| Filed by a Party other than the Registrant | o | |
| o | Preliminary Proxy Statement | |
| o | Confidential, for Use of the Commission Only (as permitted by Rule 14a-6(e)(2)) | |
| x | Definitive Proxy Statement | |
| o | Definitive Additional Materials | |
| o | Soliciting Material Pursuant to §240.14a-12 | |
| x | No fee required. | ||
| o | Fee computed on table below per Exchange Act Rules 14a-6(i)(1) and 0-11. | ||
| (1) | Title of each class of securities to which transaction applies: | ||
| (2) | Aggregate number of securities to which transaction applies: | ||
| (3) | Per unit price or other underlying value of transaction computed pursuant to Exchange Act Rule 0-11 (set forth the amount on which the filing fee is calculated and state how it was determined): | ||
| (4) | Proposed maximum aggregate value of transaction: | ||
| (5) | Total fee paid: | ||
| o | Fee paid previously with preliminary materials. | ||
| o | Check box if any part of the fee is offset as provided by Exchange Act Rule 0-11(a)(2) and identify the filing for which the offsetting fee was paid previously. Identify the previous filing by registration statement number, or the form or schedule and the date of its filing. | ||
| (1) | Amount previously paid: | ||
| (2) | Form, Schedule or Registration Statement No.: | ||
| (3) | Filing Party: | ||
| (4) | Date Filed: | ||


| Board Recommendation | |||||
| 1 | Elect two directors, both for a term of three years; | FORMs. Jones and Ms. Mallesch | WHEN May 15, 2019 2:00 p.m. Eastern Daylight Saving Time | ||
| 2 | Vote, on an advisory basis, to approve executive compensation; | FOR | |||
WHERE Libbey Corporate Showroom 335 North St. Clair Street Toledo, Ohio 43604 | |||||
| 3 | Vote to approve the Amended & Restated Libbey Inc. 2016 Omnibus Incentive Plan; | FOR | |||
| 4 | Vote to ratify the appointment of | FOR | |||
RECORD DATE Close of business on March 20, 2019 | |||||
| IN PERSON | VIA MAIL | VIA PHONE | VIA INTERNET | |||
| Attend the Annual Meeting and vote by ballot | Complete, sign, date and return your proxy card in the envelope provided | Call toll-free 1-800-690-6903 | Go to www.proxyvote.com | |||


| A MESSAGE FROM THE LEAD INDEPENDENT DIRECTOR |  |
Dear Fellow Shareholders, 2018 marked Libbey’s 200th anniversary. Celebrating such a historic milestone provides an opportunity to reflect on the past and look to the future. We value our shareholders, customers, and employees whose dedication and support during the past two centuries have helped us to become the world’s leading global glass tableware manufacturer. In turning to the next 200 years, we are inspired to accelerate Libbey’s evolution and deliver improved performance and value to our stakeholders. On March 25, 2019, Michael P. Bauer became Libbey’s new Chief Executive Officer, succeeding Bill Foley, who retired from the CEO role effective March 24, 2019. As part of Libbey's succession planning process, which has been underway for some time, we undertook an extensive search and our Board believes that Mike is the ideal candidate to succeed Bill. Mike’s considerable knowledge of manufacturing, marketing, supply chain and finance will complement our business and help us continue to drive profitable growth, operational excellence and organizational excellence. We are confident that Mike, working together with our strong management team, will build upon the momentum created under Bill’s leadership. Bill has overseen a critical period in Libbey's commercial transformation over the past several years, including the creation of our highly successful and expanding e-commerce platform, reinvigoration of a culture of product innovation that is driving new product choices for our customers and significant contributions to net sales, and technology investments that are critical to improving our operational performance. Bill has guided Libbey through a particularly challenging competitive environment, helping to maintain and grow our leading industry position. We sincerely appreciate his hard work and commitment. We are also grateful to continue to have his insights and contributions as Executive Chairman of the Board of Directors. The Board believes that the mix of institutional knowledge and fresh perspectives among our leadership team, combined with the significant progress made toward executing our strategic priorities, makes Libbey poised to deliver future growth and stability. We thank you for your continued support. Sincerely, John C. Orr Lead Independent Director | |
| ORGANIZATIONAL EXCELLENCE | ||||
| Improving marketing capabilities in new product development and innovation to drive profitable growth | Improving operating processes, systems and technology | Building winning teams that foster high performance and live our core values | ||
| • | Our adjusted EBITDA (calculated as shown in Appendix A) for 2018 was $71.0 million, compared to $70.6 million in 2017. |
| Voting Proposals and Board |
| PROPOSAL NO. 1 | |
| ELECTION OF DIRECTORS | |
| Election of Ginger M. Jones and Eileen A. Mallesch as Class II directors | þ |
| GINGER M. JONES, 54 | EILEEN A. MALLESCH, 63 | |||
 | Retired, Senior Vice President, Chief Financial Officer of Independent |  | Professional Board Member Director Since 2016 Independent | |
Qualifications • Experience as chief financial officer of a public company with over $2 billion in revenues • Significant executive leadership experience in financial strategy and experience in public audit functions, resulting in her qualification as an audit committee financial expert • Experience in global supply chain Libbey Committees • Audit Chair • Compensation Other Current Public Company Boards • Tronox Limited (NYSE: TROX) | • Public company board and corporate governance experience • Experience with mergers, acquisitions and divestitures • International business experience • Foodservice industry knowledge Libbey Committees • Audit • Compensation Other Current Public Company Boards • Fifth Third Bancorp (NASDAQ: FITB) • State Auto Financial Corp. (NASDAQ: STFC) • Brighthouse Financial, Inc. (NASDAQ: BHF) | |||
| DIRECTOR NOMINEES | |||||||||
| ü | ü | ü | ü | ||||||
| ARE INDEPENDENT | HAVE SIGNIFICANT EXECUTIVE LEADERSHIP EXPERIENCE | HAVE OTHER PUBLIC COMPANY BOARD EXPERIENCE | HAVE FINANCIAL STRATEGY EXPERTISE | ||||||
| Name and Age | Independent | Director Since | Libbey Committees | Other Current Public Company Boards | ||||
Michael P. Bauer, 54 | No | 2019 | None | |||||
| CEO, Libbey Inc. | ||||||||
| No | 1994 | Myers Industries, Inc. | ||||||
| Executive Chairman, Libbey Inc. | ||||||||
Deborah G. Miller, 69 | Yes | 2003 | A | Sentinel Group Funds, Inc. | ||||
| CEO, Enterprise Catalyst Group | N&G | |||||||
Carol A. Moerdyk, 68 | Yes | 1998 | C | American Woodmark Corporation | ||||
| SVP, International, OfficeMax Incorporated (retired) | N&G | |||||||
Steve Nave, 49 | Yes | 2017 | C | None | ||||
| President, CEO and a director, Bluestem Group Inc. (retired) | N&G* | |||||||
John C. Orr, 68 | Yes | 2008 | A | None | ||||
| President, CEO and a director, Myers Industries, Inc. (retired) | N&G | |||||||
| BOARD SNAPSHOT | |||
| INDEPENDENT | TENURE OF LESS THAN 7 YEARS | WOMEN |
6/8 | 4/8 | 4/8 |
 |  |  |
| Executive Compensation |
| PROPOSAL NO. 2 | ||||
| ADVISORY SAY-ON-PAY | ||||
We are providing shareholders the opportunity to cast an advisory vote with respect to the following resolution: RESOLVED, that the | ||||
| þ | ||||
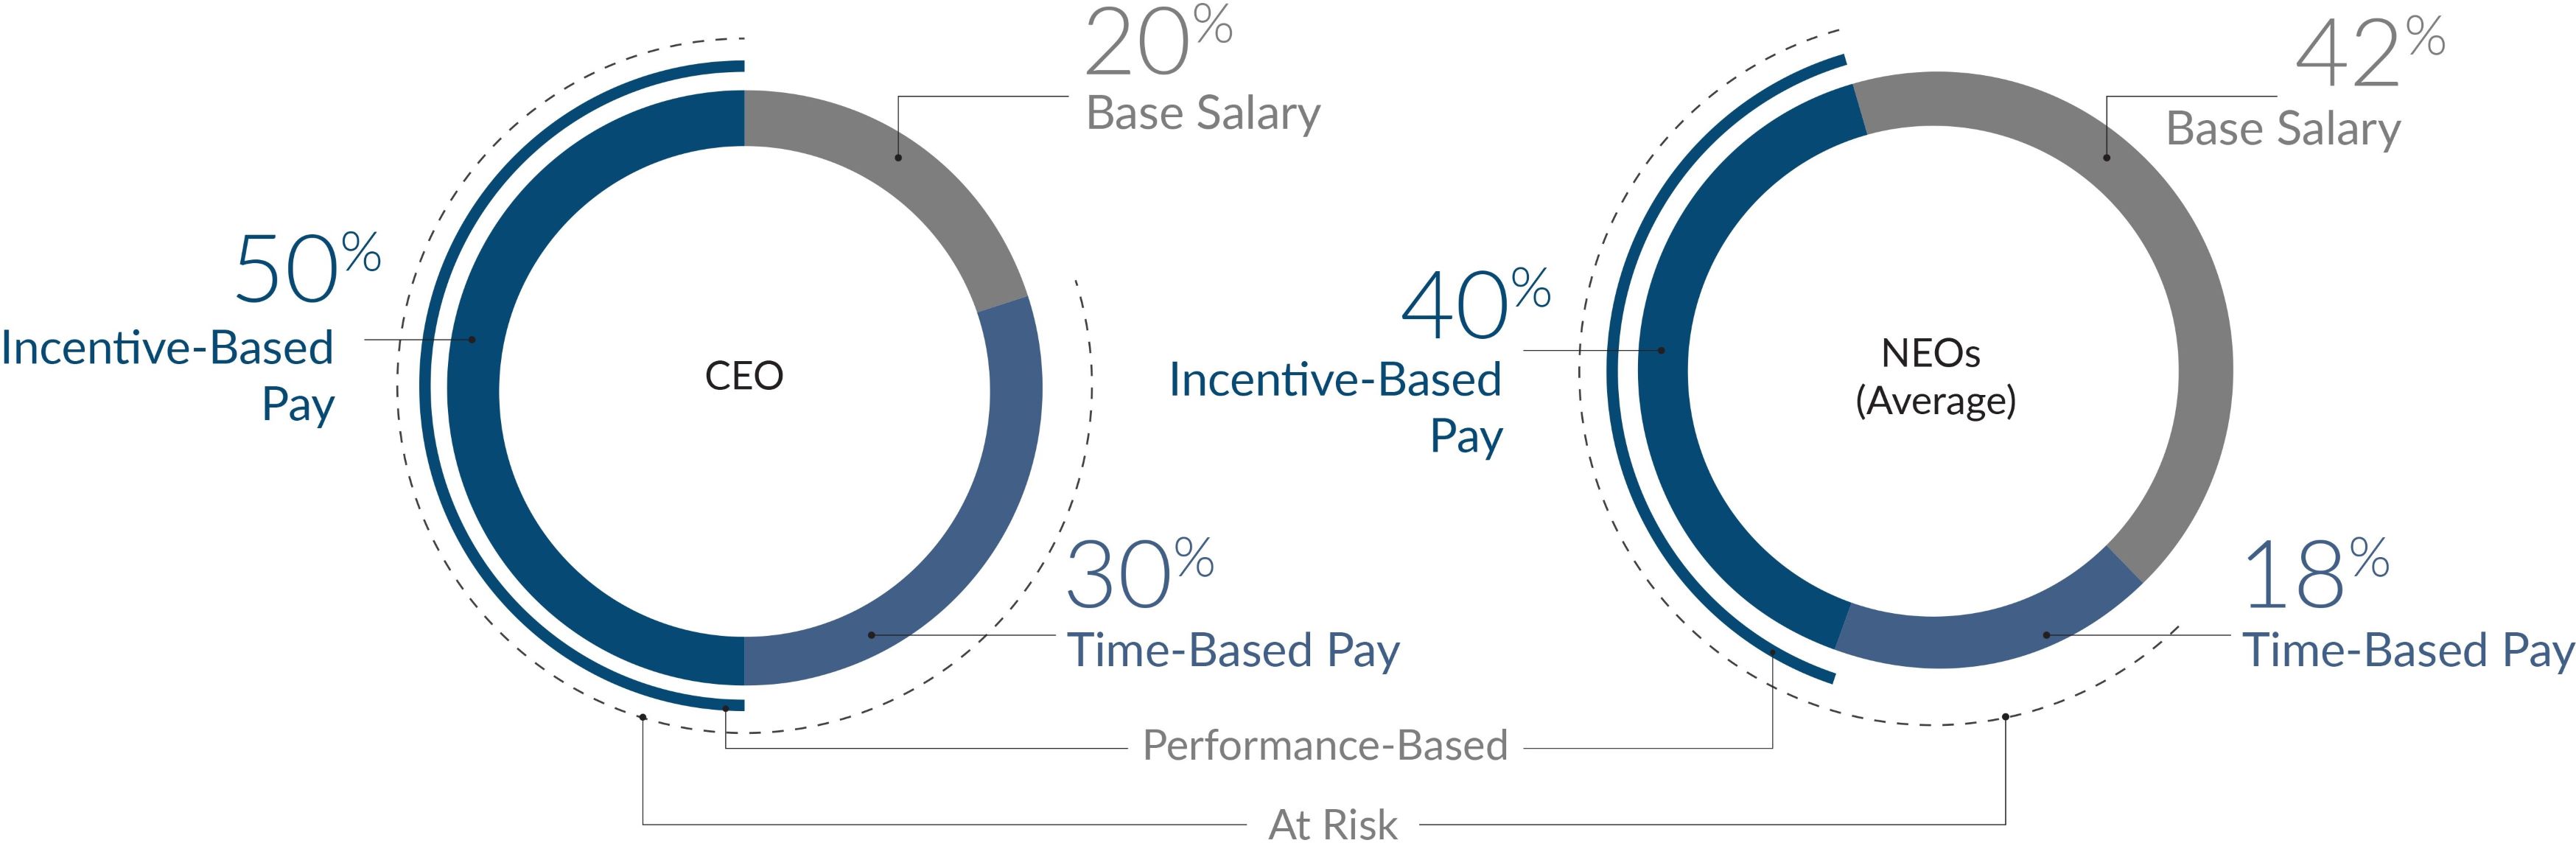
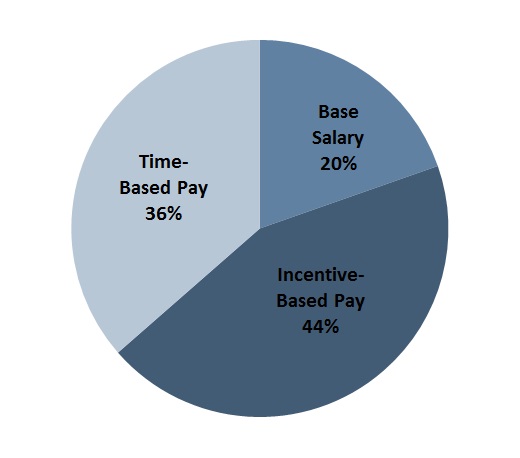
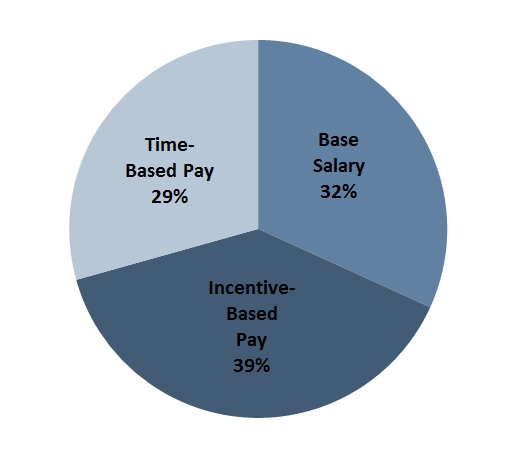
| CEO | Element | Key Characteristics | NEOs | |||||
| 20% | 42% | |||||||
| BASE SALARY | ||||||||
| Base Salary | Fixed component; reviewed annually | |||||||
| 50% | ||||||||
INCENTIVE-BASED PAY (Performance-Based; At Risk) | ||||||||
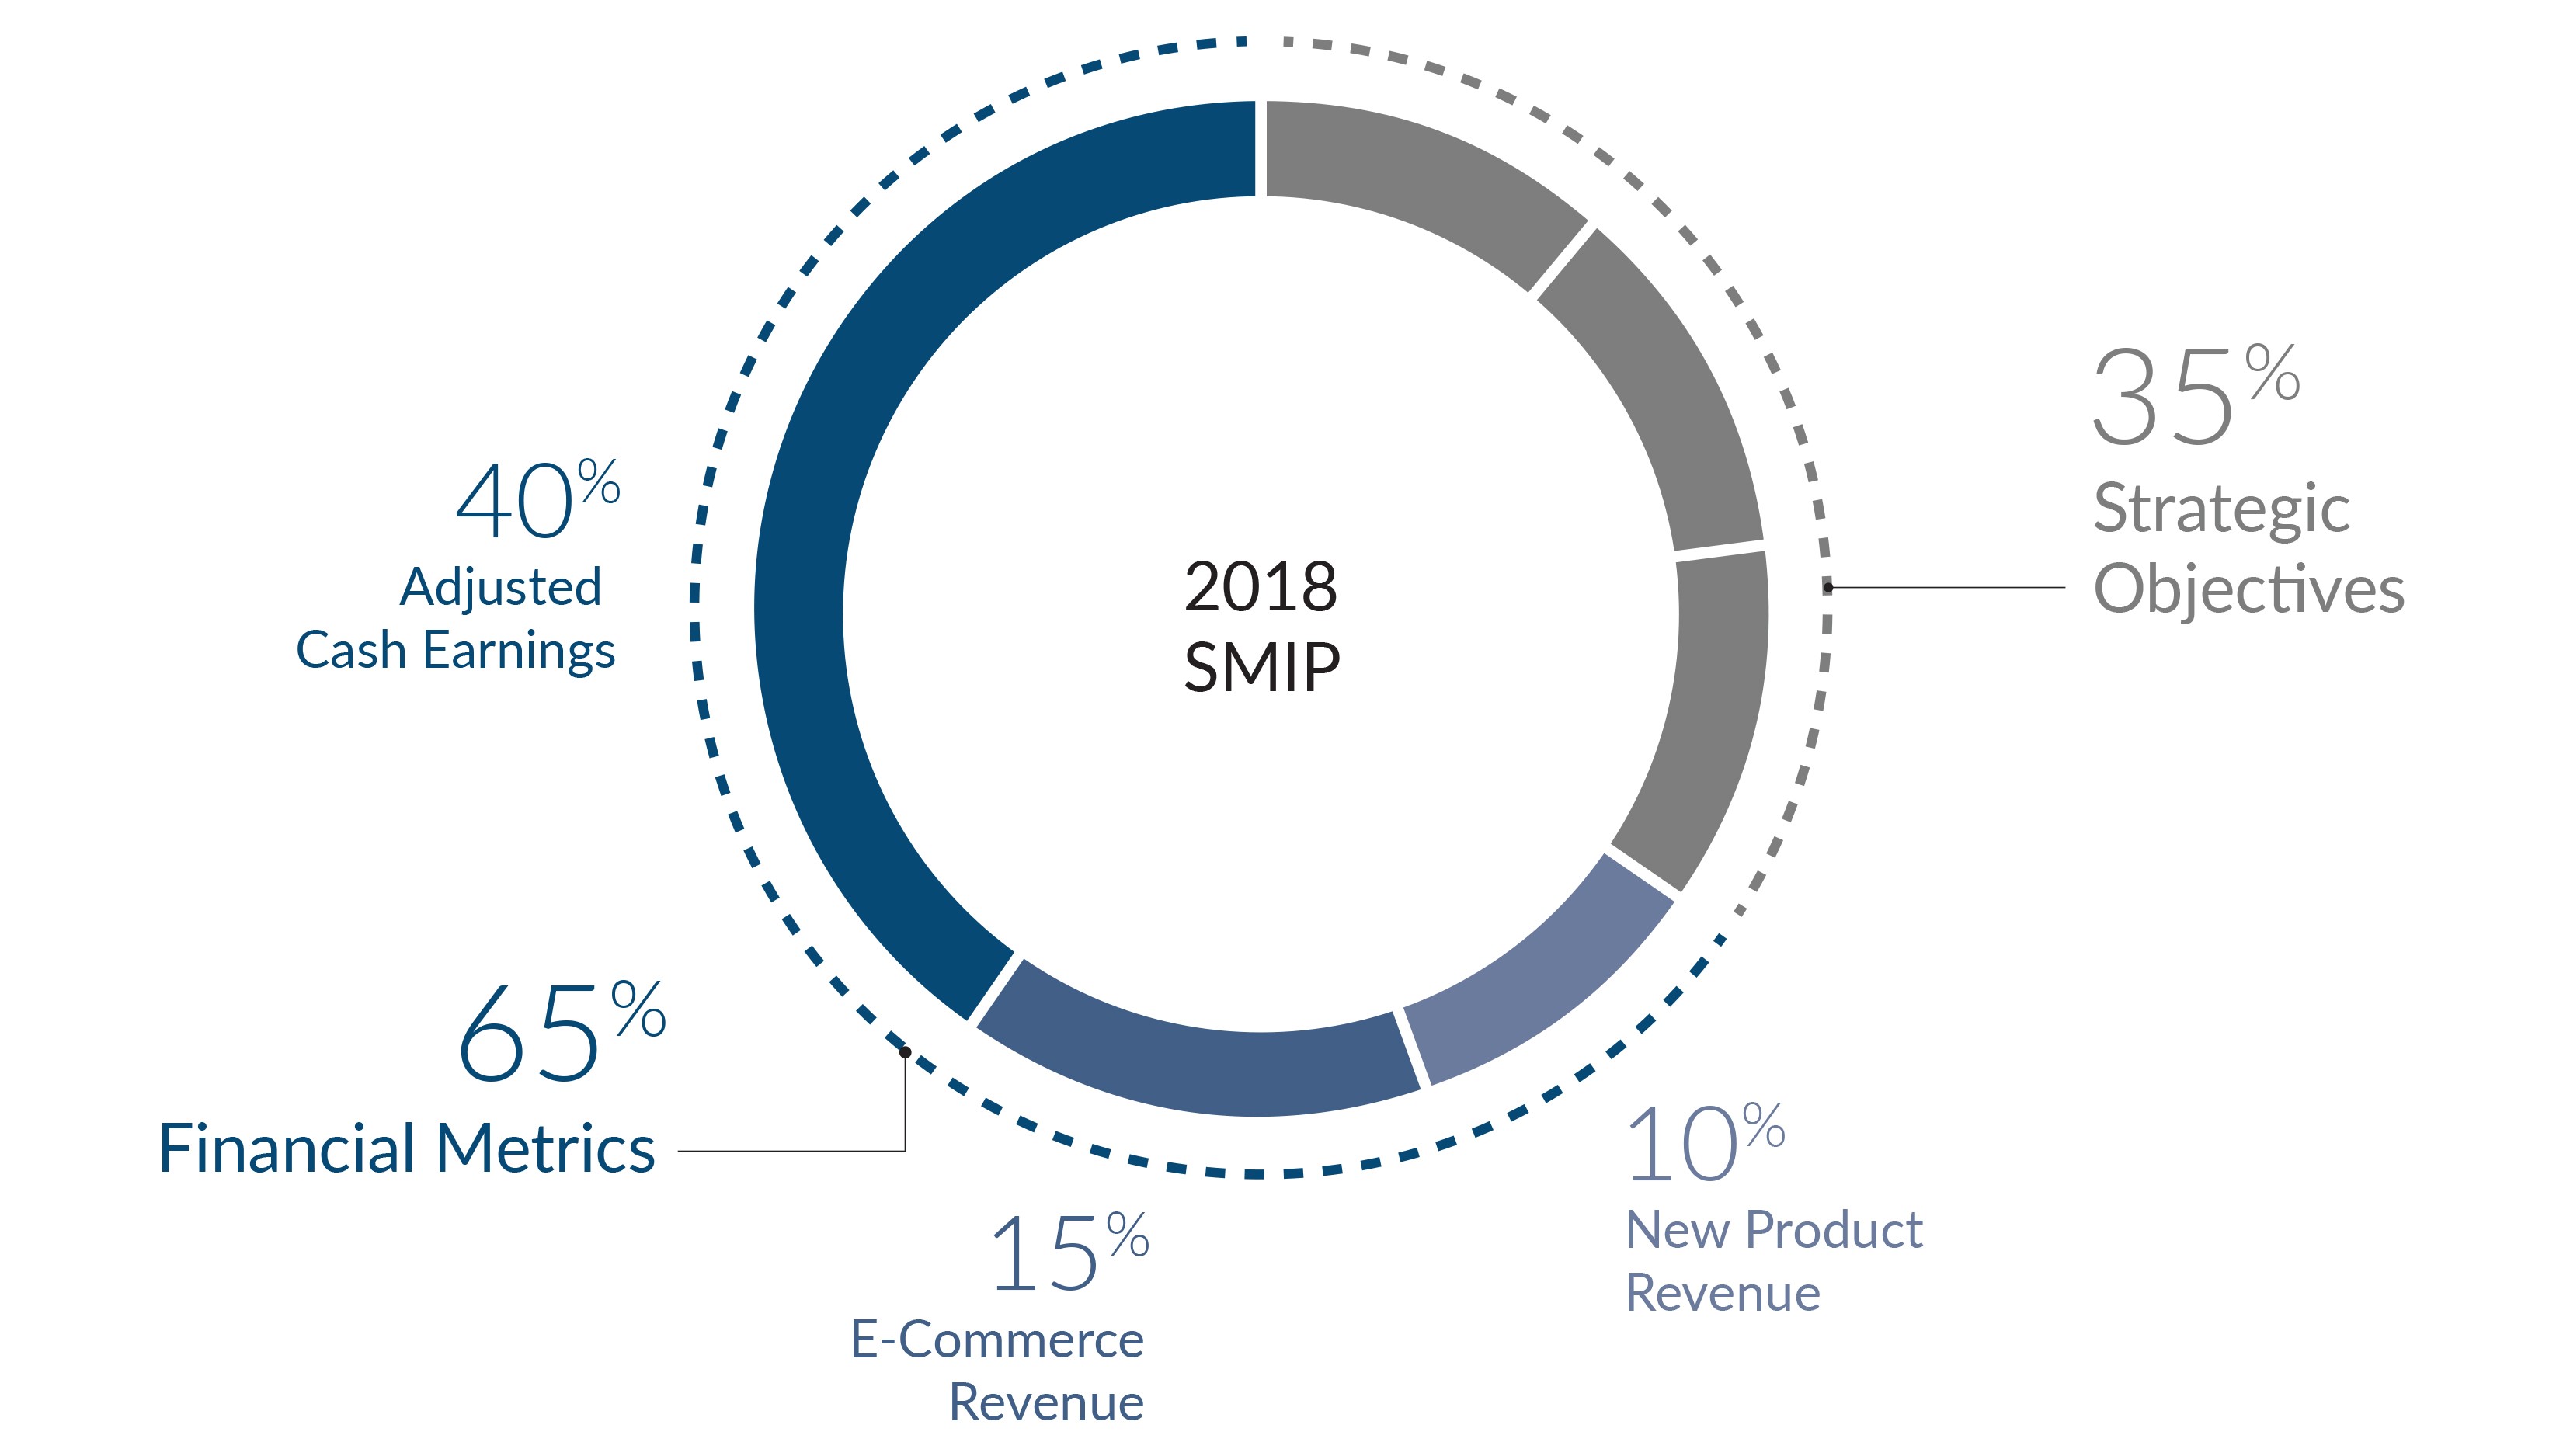
| Annual cash incentive award under our SMIP | At-risk variable pay opportunity for short-term performance; based 65% on financial metrics (40% adjusted cash earnings, 15% e-commerce revenue, 10% new product revenue) and 35% on strategic objectives; no guaranteed minimum payout; maximum payout of 200% of target | |||||||
| 40% | ||||||||
| Long-term performance cash incentive awards under our LTIP | Formula-driven, at-risk cash award that comprises 50% of LTIP opportunity; based on adjusted EBITDA; no guaranteed minimum payout; maximum payout of 200% of target | |||||||
| 30% | ||||||||
TIME-BASED PAY (At Risk) | ||||||||
| 18% | ||||||||
| Restricted stock units (RSUs) granted under our LTIP | Intended to comprise 50% of LTIP opportunity; vest ratably over four years; no dividends or voting rights with respect to unvested RSUs | |||||||
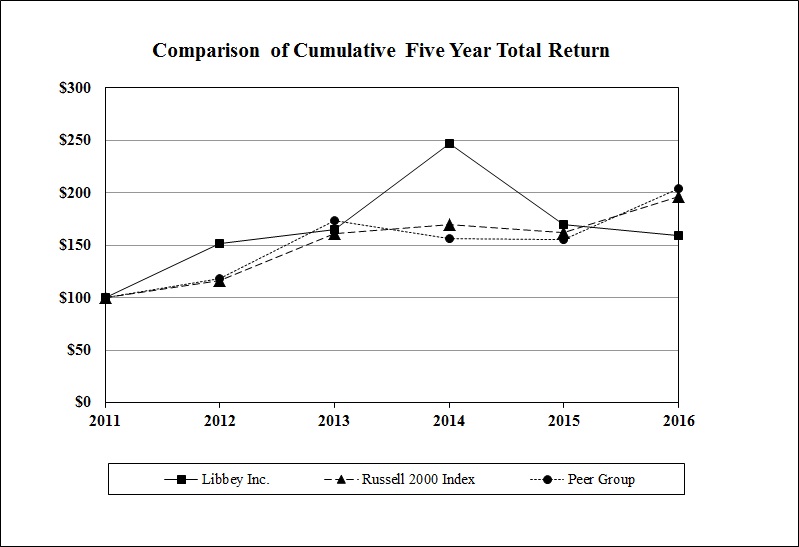
| Company / Index | Base Period Dec 2011 | Indexed Returns Years Ending | ||||
| Dec 2012 | Dec 2013 | Dec 2014 | Dec 2015 | Dec 2016 | ||
| Libbey Inc. | 100 | 151.88 | 164.84 | 246.78 | 169.64 | 158.93 |
| Russell 2000 Index | 100 | 116.35 | 161.52 | 169.43 | 161.95 | 196.45 |
| Peer Group | 100 | 118.33 | 173.49 | 156.65 | 155.96 | 203.80 |
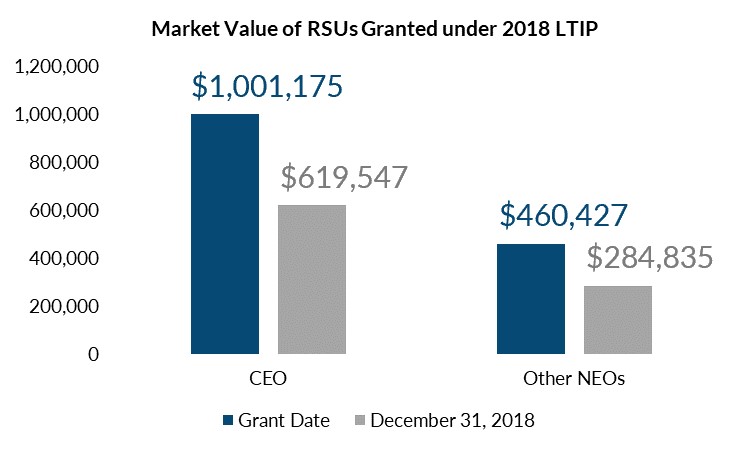
| INCENTIVE PAYMENTS BELOW TARGET | REDUCED LONG-TERM INCENTIVE VALUE | DECLINE IN RSU VALUE | ||||
| Mr. Foley's annualized salary has never been above $825,000, the initial rate established at his time of hire in January 2016 | LTIP payouts were only 19.7% of target; SMIP payouts were 90.3% to 99.4% of target | To conserve shares, the Committee changed the method used to calculate the number of RSUs awarded in 2018, thereby reducing the economic value of RSUs awarded in 2018 by 21% to 26% compared to the |
| RSUs granted in 2018 have declined in value since grant date | ||
| CEO Target Pay Opportunity vs. Realizable Pay | ||
Target Pay includes: • annualized base salary at the rate in effect as of January 1, 2018; • 2018 SMIP target opportunity as estimated at the time of grant; • performance cash target opportunity under the 2016 LTIP (for the 2016-2018 performance cycle); • the grant date fair value of RSUs granted in 2018 pursuant to our 2018 LTIP; and • the value of "All Other Compensation" as reported in the Summary Compensation Table. | 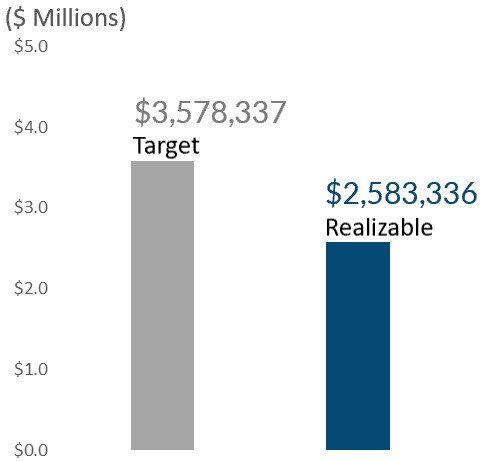 | Realizable Pay includes: • actual base salary; • actual payout under the 2018 SMIP; • actual performance cash payout under the 2016 LTIP (for the 2016-2018 performance cycle); • the market value of RSUs granted in 2018 pursuant to our 2018 LTIP; and • the value of "All Other Compensation" as reported in the Summary Compensation Table. The market value was determined by multiplying the number of RSUs by $3.88, the closing price of our common stock on the last trading day of 2018. |
üWHAT WE DO | ûWHAT WE DON’T DO | |||
ü | We tie pay to performance by ensuring that a significant portion of executive pay is performance-based | |||
| ü | Periodically, we review market data relative to our peer group of companies, and we utilize tally sheets to ensure compensation opportunities are consistent with the Compensation | |||
ü | We mitigate undue risk by emphasizing long-term incentives and using caps on potential payouts under both our annual and long-term incentive plans, clawback provisions in our Omnibus Incentive | |||
ü We have modest post-employment and change in control arrangements that apply to our executives and are competitive with market practices. ü We utilize “double-trigger” vesting of equity awards and non-equity incentives after a change in control. ü We provide only limited perquisites that we believe have a sound benefit to our business. ü We have stock retention requirements to enhance alignment of our executives’ interests with those of our shareholders. ü Our Compensation Committee retains an external, independent compensation consultant and other external advisors as needed. | û We do not maintain compensation programs that we believe create undue risks for our business. û We do not provide significant additional benefits to executive officers that differ from those provided to all other U.S. employees. û We do not permit repricing of stock options or SARs, nor do we permit buyouts of underwater stock options or SARs. ûWe do not permit hedging, pledging or engaging in transactions involving derivatives of our stock. | |||
ûWe do not have employment agreements with our | ||||
ûOur | change in control benefits do not include tax "gross-ups." | |||
| Equity Compensation Plan Information |
| AMENDED AND RESTATED LIBBEY INC. 2016 OMNIBUS INCENTIVE PLAN | |
| Approval of the Amended and Restated Libbey Inc. 2016 Omnibus Incentive Plan. | þ |
The Board of Directors recommends a vote FOR this Proposal. | |
| Audit-Related Matters |
| PROPOSAL NO. 4 | |
| RATIFICATION OF INDEPENDENT AUDITORS | |
| þ | |
| recommends a vote FOR this Proposal | |
| LIBBEY INC. PROXY STATEMENT | ||
PROPOSAL NO. 1 | |
| ELECTION OF DIRECTORS | |
| Election of Ginger M. Jones and Eileen A. Mallesch as Class II Directors. | þ |
The Board recommends a vote FOR each Director Nominee. | |
REQUISITE CHARACTERISTICS FOR BOARD CANDIDATES • the highest professional and personal ethics and values, consistent with long-standing Libbey values and standards • broad experience at the policy-making level in business, government, education, technology or public interest • commitment to enhancing shareholder value • devotion of sufficient time to carry out the duties of Board membership and to provide insight and practical wisdom based upon experience • expertise in areas that add strategic value to the Board - for example, e-commerce experience, consumer products experience; omni-channel experience; brand marketing experience; diversity of race, ethnicity, gender, age, cultural background or professional experience; broad international exposure or specific in-depth knowledge of a key geographic growth area; shared leadership model experience; extensive knowledge of the Company’s business or in a similar type industry or manufacturing environment; mergers and acquisitions; global business integration experience; significant sophisticated financial understanding or experience; global supply chain expertise; transformative change management experience; information technology or enterprise risk management implementation experience; sitting chief executive officer or chief financial officer of a public company; financial acumen; investor relations experience; and risk oversight or management experience • serve on the boards of directors of no more than three other public companies and, if intending to serve on the Audit Committee of the Board, serve on the audit committees of no more than two other public companies |
 | GINGER M. JONES | ||
 | |||
 | |||
 | |||
 | Class II Age | ||
 | Director since 2013 | Independent | Director • Experience as chief financial officer of a public company with over $2 billion in revenues • Significant executive leadership experience in financial strategy and experience in public audit functions, resulting in her qualification as an audit committee financial expert • Experience in global supply chain | ||
Professional Experience Ms. Jones Education Public Company Boards Ms. Jones currently serves on the Board of Directors of Tronox Limited (NYSE: TROX) (since April 2018). | |||||
 | EILEEN A. MALLESCH | ||||
 | Class II Age Director since 2016 | Independent | Director • Significant financial and enterprise risk management expertise • Public company board and corporate governance experience • Experience with mergers, acquisitions and divestitures • International business experience • Foodservice and consumer products industry knowledge | ||
Professional Ms. Mallesch served as Senior Vice President and Chief Financial Officer of the property and casualty insurance business of Nationwide Insurance from 2005 to 2009. Previously, Ms. Mallesch was employed by General Electric, where she served as Senior Vice President and Chief Financial Officer of Genworth Financial Life Insurance Company from 2003 to 2005; Vice President and Chief Financial Officer of GE Financial Employer Services Group from 2000 to 2003; and Controller for GE Americom from 1998 to 2000. Ms. Mallesch’s positions before 2000 include International Business Area Controller, Energy Ventures for Asea Brown Boveri, Inc., a multinational power and automation technologies company, and financial management positions with PepsiCo, Inc. (NYSE: PEP). Ms. Mallesch is a certified public accountant and began her career as a senior auditor with Arthur Andersen. Education Public Company Ms. Mallesch currently serves on the boards of directors of Brighthouse Financial (NASDAQ: BHF) (since November 2018), Fifth Third Bancorp (NASDAQ:FITB) (since 2016) | |||||
 | MICHAEL P. BAUER | ||
Class I Age 54 Chief Executive Officer since 2019 Director since 2019 | Director Qualifications: • Demonstrated ability to turn around and grow businesses under difficult circumstances • Significant financial and leadership skills • Substantial marketing, product development and supply chain experience | ||
Professional Experience Michael P. Bauer joined Libbey as Chief Executive Officer and a director on March 25, 2019. Before joining Libbey, Mr. Bauer spent more than 20 years with Fortune Brands Home & Security, Inc. (NYSE: FBHS), serving most recently as President of The Master Lock Company (the Security segment of Fortune Brands) from December 2014 to September 2018. Mr. Bauer previously held roles of increasing responsibility at Moen Incorporated, another Fortune Brands subsidiary, beginning in 1997 as Corporate Controller and culminating in his roles as Vice President and General Manager, Retail Business, from 2007 to 2011, and President, U.S. Business, from 2011 to 2014. Mr. Bauer’s earlier experience includes serving as Chief Financial Officer and Vice President of Finance for Nook Industries, Inc. (1997), holding various accounting and finance roles at Avery Dennison Corporation (NYSE: AVY) (1992 to 1997), and working as an audit manager for Coopers & Lybrand (1987 to 1992). Education Mr. Bauer holds a bachelor’s degree from Cleveland State University and an M.B.A. from Case Western Reserve University. Public Company Boards None. | |||
 | WILLIAM A. FOLEY | ||
Class III Age 71 Executive Chairman since 2019 Chairman since 2011 Director since 1994 | Director Qualifications: • Consumer product marketing experience, particularly in the glass tableware industry • Significant organizational leadership and management skills • Public company board and corporate governance experience | ||
Professional Experience Mr. Foley served as Libbey's Chief Executive Officer from January 2012 until his retirement on March 24, 2019. Following his retirement, Mr. Foley remains an employee and serves as Executive Chairman of the Board. Mr. Foley has been Chairman of the Board since 2011 and a director since 1994. Mr. Foley served as Chairman and Chief Executive Officer of Blonder Accents, LLC from June 2011 until November 2011 and served as Chairman and Chief Executive Officer of Blonder Company from 2008 until June 2011. Previously, Mr. Foley was President and a director of Arhaus, Inc.; co-founder of Learning Dimensions LLC; Chairman and Chief Executive Officer of LESCO Inc.; and Chairman and Chief Executive Officer of Think Well Inc. Mr. Foley also fulfilled the roles of Vice President, General Manager for The Scotts Company Consumer Division, and Vice President and General Manager of Rubbermaid Inc.’s Specialty Products division. Mr. Foley spent the first 14 years of his career with Anchor Hocking Corp. in various positions, including Vice President of Sales & Marketing of the Consumer and Industrial Products Group. Education Mr. Foley holds a bachelor’s degree from Indiana University and an M.B.A. from Ohio University. Public Company Boards Mr. Foley has been a member of the Board of Directors of Myers Industries, Inc. (NYSE: MYE) since 2011. | |||
 | DEBORAH G. MILLER | ||||
 Age 69 Director since 2003 Independent | • Global management experience • Sales and marketing ingenuity • Extensive information technology experience | ||||
Professional Experience From 2003 to the present, Ms. Miller has been Chief Executive Officer of Enterprise Catalyst Group, a management consulting firm specializing in high technology and biotechnology transformational applications. Ms. Miller was also President, Chief Executive Officer and Chairman of Ascendent Systems, a provider of enterprise voice mobility solutions, from 2005 to 2007. Ms. Miller has more than 30 years of global management experience, including roles as Chief Executive Officer of Maranti Networks; President and Chief Executive Officer of Egenera; Chief Executive Officer of On Demand Software; and various positions with IBM. Throughout her career, Ms. Miller has contributed to the success of international business enterprises with her innovative approach to sales and marketing. Education Ms. Miller has a bachelor’s degree from Wittenberg University, of which she is an Emeritus member of the Board of Directors. Public Company Boards Ms. Miller has been a member of the Board of Directors of Sentinel Group Funds, Inc. (SENCX) since 1995. | |||||
 | CAROL B. | ||||
Class I Age Director since 1998 | Independent | Director • Significant financial expertise developed through her experience as a CFA and public company chief financial officer • Public company board and corporate governance experience • Executive leadership and U.S. and international operations experience | |||
Professional Experience Ms. Moerdyk retired from OfficeMax Incorporated (formerly Boise Cascade Office Products Corporation) in 2007. At OfficeMax, she served as Senior Vice President, International from August 2004 until her retirement. Previously, she held various roles at Boise Cascade Office Products Corporation, including Senior Vice President Administration, Senior Vice President North American and Australasian Contract Operations, and Chief Financial Officer. Ms. Moerdyk began her professional career as an assistant professor of finance at the University of Maryland. Education Public Company Boards Ms. Moerdyk has served on the Board of Directors of American Woodmark Corporation (NASDAQ: AMWD) since 2005. | |||||
 | STEVE NAVE | ||
Class III Age 49 Nominated in 2017 Independent | Director Qualifications: • Extensive e-commerce experience • Deep knowledge of retail and consumer products industries • Significant executive leadership experience • Brand marketing expertise | ||
Professional Experience Mr. Nave is the retired President and Chief Executive Officer of Bluestem Group Inc., a holding company whose businesses include Bluestem Brands, Inc., a multi-brand, online retailer of a broad selection of name-brand and private label general merchandise through 16 unique retail brands. Mr. Nave served in that position from November 2014, when a subsidiary of Bluestem Group Inc. acquired Bluestem Brands, Inc., until February 2018, when he retired. Mr. Nave continues to serve as a director of Bluestem Group Inc. (since November 2014). From December 2012 until November 2014, Mr. Nave served as President and Chief Executive Officer and a director of Bluestem Brands, Inc. Prior to Bluestem, Mr. Nave held several executive leadership positions with Walmart.com, from its launch in 2000 until 2011, including Chief Financial Officer, Chief Operating Officer, and most recently as its chief executive, as well as serving as a senior officer of Wal-Mart Stores, Inc. From 1995 to 2000 he served in both the Audit and Mergers & Acquisitions practices of Ernst & Young, LLP, serving clients in the Retail & Consumer Products and Technology industries. Mr. Nave previously served on the board of directors of Shopzilla, Inc., a leading source of sales and consumer feedback for online merchants and retail advertisers in the United States and Europe. Education Mr. Nave has a bachelor’s degree in Accounting from Oklahoma State University. Public Company Boards None. | |||
  | |||||
Class I Age Director since 2008 | Lead Independent Director since 2016 | Director • Extensive international manufacturing and plant management experience • Extensive organizational leadership experience • Public company board and corporate governance experience | |||
Professional Experience From 2005 until his retirement in December 2015, Mr. Orr served as President, Chief Executive Officer, and a director of Myers Industries, Inc. (NYSE: MYE), an international manufacturer of polymer products for industrial, agricultural, automotive, commercial and consumer markets. Before assuming those positions, Mr. Orr was President and Chief Operating Officer of Myers Industries and General Manager of Buckhorn Inc., a Myers Industries subsidiary. Mr. Orr’s earlier career included 28 years with The Goodyear Tire and Rubber Company, Education Public Company Boards Mr. Orr served on the Board of Myers Industries, Inc. (NYSE: MYE) from May 2005 to December 2015. | |||||
| Audit Committee | Compensation Committee | Nominating and Governance Committee | ||||||||||
| Director | 2016 | 2017 | 2016 | 2017 | 2016 | 2017 | ||||||
| Carlos V. Duno | Chair | Chair | Member | Member | ||||||||
William A. Foley(1) | ||||||||||||
Ginger Jones(2)(3) | Chair | Chair | Member | Member | ||||||||
Theo Killion(3)(4) | Member | Member | ||||||||||
Eileen A. Mallesch(2)(3) | Member | Member | Member | Member | ||||||||
Deborah G. Miller(3) | Member | Member | Member | Member | ||||||||
| Carol B. Moerdyk | Member | Member | Member | Member | ||||||||
John C. Orr(2)(3) | Member | Member | Chair | Chair | ||||||||
| Board Structure |
| AUDIT COMMITTEE | |
Ginger Jones(1)(2), Chair Eileen A. Mallesch(1)(2) Deborah G. Miller(2) John C. Orr(1)(2) Number of 2018 Meetings: 7 | See “Audit-Related Matters – Report of the Audit Committee” on page 70. |
| COMPENSATION COMMITTEE | |
Carlos V. Duno, Chair(3) Ginger Jones Eileen A. Mallesch Carol B. Moerdyk Steve Nave(3) Number of 2018 Meetings: 6 | • Consider the potential impact of our executive pay program on our risk profile • Review executive pay at comparable companies and recommend to the Board pay levels and incentive compensation plans for our executives • Review and approve goals and objectives relevant to the targets of the executive incentive compensation plans • Establish the CEO’s pay, and in determining the long-term incentive compensation component of the CEO’s pay, consider the Company’s performance, relative shareholder return, the value of similar awards to chief executive officers at comparable companies and the awards given to the CEO in prior years • Annually evaluate the Compensation Committee’s performance and effectiveness • Produce an annual report on executive compensation for inclusion in the proxy statement or annual report on Form 10-K, as required by the SEC • Approve award grants under our equity participation plans and oversee and administer these plans |
| NOMINATING AND GOVERNANCE COMMITTEE | |
John C. Orr, Chair Carlos V. Duno(3) Deborah G. Miller Carol B. Moerdyk Number of 2018 Meetings: 5 | • Develop and implement corporate governance policies and practices • Establish a selection process for new directors to meet the needs of the Board, evaluate and recommend candidates for Board membership, assess the Board's performance and review that assessment with the Board and establish objective criteria to evaluate the CEO's performance • Review director pay and recommend to the Board pay levels for our non-management directors • Review plans for both emergency and orderly succession of the CEO |
| (1) | Determined by the Board to be qualified as an audit committee financial expert, as defined in SEC regulations. |
| (2) | Determined by the Board to be financially sophisticated and literate and to have accounting and related financial management expertise, as those qualifications are interpreted by the Board in its business judgment. |
| (3) | Effective May 14, 2019, Mr. Nave will replace Mr. Duno as Chair of the Compensation Committee and as a member of the Nominating and Governance Committee. Mr. Duno will retire from the Board effective immediately preceding the Annual Meeting on May 15, 2019. |
| Board Processes |
| Non-Management Directors' Compensation |
| ELEMENT OF COMPENSATION | ANNUAL COMPENSATION AMOUNT | |
| Annual Cash Retainer | $47,500 (increased to $62,000 effective January 1, 2019) | |
| Lead Independent Director Cash Retainer | $20,000 | |
| Equity Award | On the date of each annual meeting of shareholders, outright grant of shares of common stock valued at $80,000 on the date of grant, attributable to service during the preceding year (increased to $90,000 beginning with the grant on the date of the 2019 Annual Meeting) Our stock retention guidelines require that the director hold the net after-tax shares issued for at least one year from the date of grant | |
Committee Chair Cash Retainers (in addition to Committee Member Cash Retainers) | $12,500 (Audit Committee and Compensation Committee) $6,500 (Nominating and Governance Committee) | |
| Committee Member Cash Retainers | $7,500 (Audit Committee and Compensation Committee) $5,000 (Nominating and Governance Committee) | |
| Other Fees | $500 per one-half day of service | |
| Director Compensation for Year Ended December 31, 2018 | |||||||||||
| Director | Fees Earned or Paid in Cash ($)(1) | Stock Awards ($)(2) | Change in Pension Value and Nonqualified Deferred Compensation Earnings ($)(3) | All Other Compensation ($) | Total ($) | ||||||
| Carlos V. Duno | 73,708 | 79,998 | 0 | 0 | 153,706 | ||||||
| Ginger M. Jones | 76,208 | 79,998 | 0 | 0 | 156,206 | ||||||
| Eileen A. Mallesch | 63,708 | 79,998 | 0 | 0 | 143,706 | ||||||
| Deborah G. Miller | 61,208 | 79,998 | 0 | 0 | 141,206 | ||||||
| Carol B. Moerdyk | 61,208 | 79,998 | 0 | 0 | 141,206 | ||||||
| Steve Nave | 56,208 | 79,998 | 0 | 0 | 136,206 | ||||||
| John C. Orr | 97,208 | 79,998 | 0 | 0 | 177,206 | ||||||
| (1) | Includes pay deferred into the Libbey common stock measurement fund pursuant to the Director DCP. |
| (2) | Represents the grant date fair value, determined in accordance with FASB ASC Topic 718, of awards of stock made to non-management directors on May 16, 2018. On that date, we awarded certain non-management directors stock having a grant date fair value of $6.70 per share. The awards were attributable to service during the preceding year. Pursuant to our stock ownership and retention guidelines for non-management directors, directors are required to hold the net after-tax shares issued for at least one year from the grant date. |
| (3) | We do not maintain a pension plan for our non-management directors. We do not guarantee any particular rate of return on any pay deferred pursuant to our deferred compensation plans. Dividends on pay deferred into the Libbey Inc. phantom stock or measurement fund under our deferred compensation plans for non-management directors accrue only if and to the extent payable to holders of our common stock. Pay deferred into interest-bearing accounts under our deferred compensation plans for non-management directors does not earn an above-market return, as the applicable interest rate is the yield on ten-year treasuries. Pay deferred into other measurement funds under our deferred compensation plans for non-management directors does not earn an above-market return, as that pay earns a return only if and to the extent that the net asset value of the measurement fund into which the pay is deemed invested actually increases. |
MICHAEL P. BAUER - CHIEF EXECUTIVE OFFICER | |
| Biographical information for Mr. Bauer appears on page 13. | |
JAMES C. BURMEISTER - SENIOR VICE PRESIDENT, CHIEF FINANCIAL OFFICER | |
| Mr. Burmeister, 51, has been Senior Vice President, Chief Financial Officer since June 2018. Mr. Burmeister joined Libbey as Vice President, Chief Financial Officer on March 30, 2017. Mr. Burmeister came to Libbey from The Andersons, Inc. (NASDAQ: ANDE), where he served since 2014 as Vice President, Finance and Treasurer, managing the treasury, tax, investor relations, sourcing, business development and continuous improvement functions. Before joining The Andersons, Inc., Mr. Burmeister held roles of increasing responsibility in operations finance with Owens Corning (NYSE: OC), beginning in 2005 as Director of Finance of the cultured stone business and culminating in his role from 2013-2014 as Vice President, Finance of the roofing and asphalt division. Earlier in his career, Mr. Burmeister served in a variety of roles with General Electric (NYSE: GE), including an assignment with GE's highly regarded Corporate Audit Staff, and with Rubbermaid in its supply chain function. Mr. Burmeister is a graduate of the U.S. Naval Academy and served as a commissioned officer in the U.S. Marine Corps from 1990 to 1995. | |
JAMES (KLAY) K. HUDDLESTON - SENIOR VICE PRESIDENT, CHIEF DIGITAL OFFICER | |
| Mr. Huddleston, 48, has been Senior Vice President, Chief Digital Officer since June 2018, having joined Libbey as Vice President, Chief Digital Officer on November 13, 2017. From 2008 until joining Libbey, Mr. Huddleston served as Senior Vice President, Omni-Commerce for Resource/Ammirati, an IBM (NYSE: IBM) consulting agency specializing in brand, commerce, and technology solutions to drive sales and increase customer engagement. Mr. Huddleston previously served as Vice President & General Manager, Direct for Tween Brands from 2006 to 2008 and Director, E-Commerce for Lane Bryant from 2005 to 2006. Mr. Huddleston's earlier career included various marketing and product management positions for Amazon.com, Inc. (NASDAQ: AMZN) from 1998 to 2004. | |
SUSAN A. KOVACH - SENIOR VICE PRESIDENT, GENERAL COUNSEL AND SECRETARY | |
| Ms. Kovach, 59, has been Senior Vice President, General Counsel and Secretary of Libbey Inc. since June 2018. Ms. Kovach was Vice President, General Counsel and Secretary of Libbey Inc. from July 2004 until June 2018, having joined Libbey in December 2003 as Vice President, Associate General Counsel and Assistant Secretary. Ms. Kovach was Of Counsel to Dykema Gossett PLLC from 2001 through November 2003. She served from 1997 to 2001 as Vice President, General Counsel and Corporate Secretary of Omega Healthcare Investors, Inc. (NYSE: OHI) and from 1998 to 2000 as Vice President, General Counsel and Corporate Secretary of Omega Worldwide, Inc., a NASDAQ-listed firm. Prior to joining Omega Healthcare Investors, Inc., Ms. Kovach was a partner in Dykema Gossett PLLC from 1995 through November 1997 and an associate in Dykema Gossett PLLC from 1985 to 1995. | |
WILLIAM C. MOSSING - SENIOR VICE PRESIDENT, CHIEF SUPPLY CHAIN OFFICER | |
| Mr. Mossing, 52, has been Senior Vice President, Chief Supply Chain Officer since June 2018, having joined Libbey as Vice President, Chief Supply Chain Officer on December 1, 2017. Mr. Mossing came to Libbey from Bendix Commercial Vehicle Systems LLC, where he served as Vice President, Supply Chain since 2011 and Vice President and General Manager - Modules from 2008 to 2011. Mr. Mossing previously served as Product Line Director from 2006 to 2008 and Assistant General Manager from 2004 to 2008 of Bendix Spicer Foundation Brake LLC, a joint venture of Bendix Commercial Vehicle Systems LLC and Dana Corporation. Mr. Mossing's previous experience includes various positions of increasing responsibility in the manufacturing, supply chain, and engineering functions at Dana Corporation, a predecessor to Dana Incorporated (NYSE: DAN). | |
SARAH J. ZIBBEL - SENIOR VICE PRESIDENT, CHIEF HUMAN RESOURCES OFFICER | |
| Ms. Zibbel, 39, has been Senior Vice President, Chief Human Resources Officer since June 2018, having joined Libbey in April 2018 as Vice President, Chief Human Resources Officer. Ms. Zibbel came to Libbey from Owens-Illinois, Inc. (NYSE: OI), where she most recently served as Vice President, Global Talent, Culture & Organizational Effectiveness since December 2017. Ms. Zibbel's previous positions at Owens-Illinois include Vice President, HR Strategy & Enterprise Transformation from 2016 to December 2017, Vice President, Human Resources, Global Technology and Operations from 2015 to 2016, Director, Corporate Human Resources from 2011 to 2015, and Manager, Corporate Human Resources from 2010 to 2011. Before joining Owens-Illinois, Ms. Zibbel was HR Operations Manager for Rexam PLC from 2009 to 2010, Human Resources Leader at Owens Corning (NYSE: OC) from 2005 to 2009, and Human Resource Director at MedCorp Inc. from 2002 to 2005. | |
| PROPOSAL NO. 2 | |
| ADVISORY SAY-ON-PAY | |
We are providing shareholders the opportunity to cast an advisory vote with respect to the following resolution: | þ |
The Board recommends a vote FOR this Proposal | |
| Support our business strategy; drive long-term performance and shareholder value | • | Annual and long-term incentive plan performance measures focused on growing our business profitably, improving our ability to generate cash, and improving our | |
| adjusted EBITDA • | |||
| Align interests of executives and shareholders | • | Performance-based annual and long-term incentive plans | |
• | 80% of our | ||
| “at-risk” • | |||
| RSUs directly align interests of executives and shareholders | |||
• | Stock | ||
| Attract and retain highly talented and experienced senior executives who are key to implementing our strategy and achieving future success | • | ||
| Align executive pay program with corporate governance best practices | • | Limited perquisites (tax return preparation and financial planning, executive health screening program, limited ground transportation and airline club membership) | |
• | Limited severance pay arrangements | ||
• | |||
| Stock | |||
• | Annual and long-term incentive awards and RSU | ||
| Named Executive | Title | |
William A. Foley | Executive Chairman and | |
| former Chief Executive Officer | ||
| Susan A. Kovach | Senior Vice President, General Counsel and Secretary | |
| Salvador Miñarro Villalobos | Vice President, General Manager, U.S. and Canada until his employment ended on January 15, 2018 | |
| Sarah J. Zibbel | Senior Vice President, Chief Human Resources Officer | |
PROFITABLE GROWTH | OPERATIONAL EXCELLENCE | ORGANIZATIONAL EXCELLENCE | ||
| Improving marketing capabilities in new product development and innovation to drive profitable growth | Improving operating processes, systems and technology | Building winning teams that foster high performance and live our core values | ||
| NO CEO SALARY INCREASE | INCENTIVE PAYMENTS BELOW TARGET | REDUCED LONG-TERM INCENTIVE VALUE | DECLINE IN RSU VALUE | |||
| Mr. Foley's annualized salary has never been above $825,000, the initial rate established at his time of hire in January 2016 | LTIP payouts were only 19.7% of target; SMIP payouts were 90.3% to 99.4% of target(1) | To conserve shares, the Committee changed the method used to calculate the number of RSUs awarded in 2018, thereby reducing the economic value of RSUs awarded in 2018 by 21% to 26% compared to the previous method | RSUs granted in 2018 have declined in value since grant date | |||
| • | Mr. Bauer does not have an employment agreement. Mr. Bauer is a party to a change in control agreement with the Company and is eligible to participate in the Company's Executive Severance Compensation Policy. Additional information regarding Mr. Bauer's change in control and severance benefits can be found under"Potential Payments upon Termination or Change in Control" on page 40. |
 |  | |
| Type of Pay | Element | Key Characteristics | Objectives | |||
| Base salary | Base salary | Fixed component; reviewed annually | ||||
| Incentive-Based Pay | Annual cash incentive award under our | At-risk variable pay opportunity for short-term performance; no guaranteed minimum payout; maximum payout equal to | ||||
| Long-term performance cash incentive awards under our | Formula-driven, at-risk cash award that comprises | |||||
| Time-Based Pay | ||||||
| RSUs granted under our | ||||||
| Element | Key Characteristics | Objectives | ||
| Perquisites | Direct payment or reimbursement of personal financial planning and tax return preparation fees; annual executive health screening and related services; ground transportation for trips between Toledo, Ohio, and the Detroit/Wayne County Metropolitan airport for the executive when traveling for business purposes and the executive's spouse when traveling together; membership in one airline club of the executive's choice; for executives relocating at Libbey's request, moving and related expenses associated with the move (may also include loss-on-sale protection when necessary to attract talent); and, for Mr. Foley until April 24, 2019, a housing allowance for housing in the Toledo, Ohio, area since his primary residence is in the Cleveland, Ohio, area | Attract and retain talent | ||
| Welfare and retirement benefits | Medical, dental and life insurance benefits for U.S. executives on the same basis as for all U.S. salaried employees; matching contributions to our 401(k) savings plan on the same basis as for all U.S. salaried employees; for Ms. Kovach only, retirement benefits under our Salary Plan (a qualified retirement plan for all U.S. salaried employees hired before January 1, 2006) and our Supplemental Retirement Benefit Plan ("SERP") (an excess, non-qualified plan designed to provide substantially identical retirement benefits as the Salary Plan to the extent the Salary Plan cannot provide those benefits due to IRS limitations; no enhanced credit has ever been provided). Company contribution credits under the Salary Plan and the SERP were discontinued at the end of 2012 | Attract and retain talent | ||
| Limited Income Protection | Separation benefits under change in control agreements or our executive severance policy; contingent component payable only if employment is terminated under specified circumstances | Attract and retain talent | ||
| SALARY HIGHLIGHTS | • No salary increase for CEO • No salary increases for recently hired executives • 3% - 4% salary increases for certain other named executives |
| Named Executive | Annualized Base Salary ($) | ||
| W. Foley | 825,000 | ||
| J. Burmeister | 390,000 | ||
| S. Kovach | 364,154 | ||
| S. Miñarro | 362,397 | ||
| W. Mossing | 300,000 | ||
| S. Zibbel | 310,002 | ||
• Annual Cash Incentive Award • Based 40% on Company's adjusted cash earnings, 15% on e-commerce revenue, 10% on new product revenue, and 35% on performance against strategic objectives • Named executives (excluding Mr. Miñarro) received below-target payouts ranging from 90.3% to 99.4% | |
| Named Executive | Target Award as a Percent of Full-Year Base Salary | Target Award based on Actual Full-Year Base Salary ($) | |||
| W. Foley | 100% | 825,000 | |||
| J. Burmeister | 60% | 231,750 | |||
| S. Kovach | 50% | 180,752 | |||
| W. Mossing | 50% | 150,000 | |||
| S. Zibbel | 50% | 114,313 | |||
| Adjusted Cash Earnings | ||||||||
Full-Year Adjusted Cash Earnings (dollars in thousands) | Percent of Targeted Cash Earnings | Performance Level | Payout Percentage | |||||
| $103,557 | 110.0% | Maximum | 200% | |||||
| $94,143 | 100.0% | Target | 100% | |||||
| $75,314 | 80.0% | Threshold | 50% | |||||
| < $75,314 | < 80.0% | Below Threshold | 0% | |||||
| Item | Amount of Adjustment to Company-Wide Cash Earnings ($) | ||
| Costs Related to Strategic Initiative | 2,341,000 | ||
| Total | 2,341,000 | ||
| E-Commerce Revenue | ||||||
| Full-Year E-Commerce Revenue (represented as % increase vs. prior year) | Percent of Targeted E-Commerce Revenue | Performance Level | Payout Percentage | |||
| 67% | 125% | Maximum | 200% | |||
| 33% | 100% | Target | 100% | |||
| 20% | 90% | Threshold | 50% | |||
| < 20% | < 90% | Below Threshold | 0% | |||
| New Product Gross Revenue | ||||||||
Full-Year New Product Gross Revenue (dollars in thousands) | Percent of Targeted New Product Gross Revenue | Performance Level | Payout Percentage | |||||
| $59,840 | 110.0% | Maximum | 200% | |||||
| $54,000 | 100.0% | Target | 100% | |||||
| $48,960 | 90.0% | Threshold | 50% | |||||
| < $48,960 | < 90.0% | Below Threshold | 0% | |||||
| ERP Planning and Implementation | |||||||
| Strategy Link: | Supports operational excellence and profitable growth | Threshold | Target | Maximum | Actual Performance | ||
| ERP investment is critical to driving future top-line growth and margin improvement. We anticipate that, once fully implemented, our ERP will help us achieve annual run-rate benefits of $15 - $20 million. | Execute one milestone, within budget | Execute two milestones, within budget | Execute three milestones, within budget | Executed one milestone, within budget | |||
| Measure: | Qualitative | (3 rating) | (4 rating) | (5 rating) | 3 rating | ||
| Service Levels | |||||||
| Strategy Link: | Supports profitable growth | Threshold | Target | Maximum | Actual Performance | ||
| Providing exceptional service differentiates us from our competitors. We believe superior service will help us accelerate our growth, gain stronger product placement, and enhance margins in the long term. | 83% | 86% | 90% | 90% | |||
| Measure: | Percent of customer orders filled on time and in full | (2 rating) | (3 rating) | (5 rating) | 5 rating | ||
| Individual and Leader Development | |||||||
| Strategy Link: | Supports organizational excellence | Threshold | Target | Maximum | Actual Performance | ||
| To ensure our success, our people must be strong and effective leaders who embody the right skill sets and capabilities to execute our strategy. By developing our leaders, we are preparing for continued growth as an organization, building our succession plans, and embracing a new and ever-changing workforce. | Assess 50% of leaders; train supervisors at manufacturing sites; complete development plans for 75% of salaried employees | Assess 75% of leaders; train supervisors at manufacturing sites + a non-manufacturing site; development plans for > 75% of salaried employees | Assess all leaders; train supervisors at all locations; complete development plans for all salaried employees | Assessed all leaders; trained all supervisors; completed development plans for all salaried employees | |||
| Measure: | Qualitative | (3 rating) | (4 rating) | (5 rating) | 5 rating | ||
| Strategic Objectives | ||
| Overall Rating | Payout Percentage | |
| above 4.5 | 176% - 200% | |
| 4.1 - 4.5 | 151% - 175% | |
| 3.6 - 4.0 | 126% - 150% | |
| 3.1 - 3.5 | 101% - 125% | |
| 2.6 - 3.0 | 76% - 100% | |
| 2.0 - 2.5 | 51% - 75% | |
| below 2.0 | 0% - 50% | |
| Component | Payout Score | Weight | Weighted Payout Score | Total Unadjusted Payout Score | ||||
| Adjusted Cash Earnings | 0% | 40% | 0.0% | 90.3% | ||||
| E-Commerce Revenue | 100% | 15% | 15.0% | |||||
| New Product Revenue | 170% | 10% | 17.0% | |||||
| Strategic Objectives | 166.7% | 35% | 58.3% | |||||
| Target Award | Actual Payout | ||||||||
| Named Executive | As Percent of Full-Year Base Salary | Based on Actual Full-Year Base Salary ($) | As Percent of Target | Actual Award ($) | |||||
| W. Foley | 100% | 825,000 | 99.4% | 819,775 | |||||
| J. Burmeister | 60% | 231,750 | 99.4% | 230,282 | |||||
| S. Kovach | 50% | 180,752 | 99.4% | 179,607 | |||||
| W. Mossing | 50% | 150,000 | 90.3% | 135,500 | |||||
| S. Zibbel | 50% | 114,313 | 90.3% | 103,263 | |||||
| LTIP HIGHLIGHTS | • Long-term performance cash incentive award • Based on Company's adjusted ROIC for 2016 and 2017 and adjusted EBITDA for 2018 • Below target payout of 19.7% for 2016 LTIP (for the 2016-2018 performance cycle) • 2017 LTIP (for 2017-2019 performance cycle) and 2018 LTIP (for 2018-2020 performance cycle) both tracking below target |
| Named Executive | 2018 Target Long-Term Award as a Percentage of Annualized Base Salary | |
| W. Foley | 300% | |
| J. Burmeister | 100% | |
| S. Kovach | 95% | |
| W. Mossing | 70% | |
| S. Zibbel | 70% | |
| ◦ | For any performance cycle of which 2016 is a part, our 2016 adjusted ROIC target was 10.8%. We achieved adjusted ROIC of 9.9% in 2016, resulting in a payout score for the 2016 calendar year of 59%, as determined according to the following scale: |
| Basis Points Above or Below 2016 Targeted Adjusted ROIC | Payout Score | |
| +100 | 200% | |
| 0 | 100% | |
| -150 | 25% | |
| Less than -150 | 0% | |
| ◦ | For any performance cycle of which 2017 is a part, our 2017 adjusted ROIC target was 9.2%. We achieved 2017 adjusted ROIC of 3.1%, resulting in a payout score for the 2017 calendar year of 0%, as determined according to the following scale: |
| Basis Points Above or Below 2017 Targeted Adjusted ROIC | Payout Score | |
| +50 | 200% | |
| 0 | 100% | |
| -100 | 50% | |
| Less than -100 | 0% | |
| ◦ | For any performance cycle of which 2018 is a part, our 2018 adjusted EBITDA target was $89.8 million. In setting the target, the Committee considered the Company's prior year performance and alignment with the Company's annual operating plan and long-term strategic initiatives. The volatile global economy, decline in restaurant traffic, shift in retail sales toward e-commerce, and competitive pricing environment of 2017 were expected to continue in 2018. The realities of the business environment led the Company to shift its priorities from aggressive growth toward improving marketing and new product development capabilities and innovation, improving customer relationships, and simplifying the business - all of which would support future, sustainable, profitable growth. The Committee believed that an adjusted EBITDA target of $89.8 million would prove sufficiently challenging to achieve. In February 2019, the Committee determined that we had achieved 2018 adjusted EBITDA of $72.5 million, resulting in a payout score for the 2018 calendar year of 0%, as determined according to the following scale: |
| Percent of 2018 Targeted Adjusted EBITDA | Payout Score | |
| 112.5% | 200% | |
| 0 | 100% | |
| 87.5% | 50% | |
| Less than 87.5% | 0% | |
| Payout Score | ||
| 2016 calendar year | 59% | |
| 2017 calendar year | 0% | |
| 2018 calendar year | 0% | |
| Overall Payout Score | 19.7% | |
| Named Executive | 2016 LTIP Cash Target ($) | 2016 LTIP Cash Payout ($) | 2016 LTIP Cash Payout as a Percentage of Target | |||
| W. Foley | 990,000 | 195,030 | 19.7% | |||
J. Burmeister(1) | 87,900 | 17,316 | 19.7% | |||
| S. Kovach | 127,878 | 25,192 | 19.7% | |||
S. Miñarro(1) | 114,421 | 22,541 | 19.7% | |||
W. Mossing(1) | 30,324 | 5,974 | 19.7% | |||
S. Zibbel(1) | 21,700 | 4,275 | 19.7% | |||
| (1) | Prorated to reflect the portion of the performance cycle during which the named executive was employed. |
| EQUITY HIGHLIGHTS | • Annual awards under LTIP • Economic value of RSUs at time of award intended to equal 50% of LTIP target opportunity • 4-year ratable vesting |
Annualized Salary Before Increase | Annualized Salary After Increase | |||
| Named Executive | ($) | ($) | ||
| S. Buck | 475,000 | 484,500 | ||
| A. Cerioli | 400,002 | 408,002 | ||
| S. Kovach | 336,520 | 343,250 | ||
| S. Miñarro | 350,040 | 357,041 | ||
| Revenue Growth (Net Sales) | Adjusted Cash Earnings | |||||||
Full Year Net Sales (dollars in thousands) | Percent of Targeted Net Sales | Performance Level | Payout Percentage | Full Year Cash Earnings (dollars in thousands) | Percent of Targeted Cash Earnings | Performance Level | Payout Percentage | |
| $880,000 | 104.9% | Maximum | 200% | $131,076 | 110.0% | Maximum | 200% | |
| $839,138 | 100.0% | Target | 100% | $119,160 | 100.0% | Target | 100% | |
| $800,000 | 95.3% | Threshold | 40% | $95,328 | 80.0% | Threshold | 50% | |
| < $800,000 | < 95.3% | Below Threshold | 0% | < $95,328 | < 80.0% | Below Threshold | 0% | |
| Item | Amount of Adjustment to Company-Wide Cash Earnings | |||
| Expense in connection with executive terminations | $ | 3,554,000 | ||
| Income related to natural gas contract hedge ineffectiveness | (1,860,000 | ) | ||
| 2010 Mexican tax assessment | 1,085,000 | |||
| Total | $ | 2,779,000 | ||
| Preliminary Financial Performance Payout Score as % of Target | ||||
| Revenue Growth | Adjusted Cash Earnings | Total | ||
| 47.5 | 99.0 | 73.25 | ||
| Final Financial Performance Payout Score as % of Target | ||||
| Revenue Growth | Adjusted Cash Earnings | Total | ||
| 40.0 | 99.0 | 69.5 | ||
| Named Executive | 2016 Target Long-Term Award as a Percentage of Annualized Base Salary (%) | 2016 LTIP Performance Cash Target as Percentage of Annualized Base Salary (%) | ||
| W. Foley | 300 | 120 | ||
| S. Streeter | 300 | 120 | ||
| S. Buck | 140 | 56 | ||
| A. Cerioli | 120 | 48 | ||
| S. Kovach | 95 | 38 | ||
| S. Miñarro | 120 | 48 | ||
| J. White | 150 | 60 | ||
| Basis Points Above or Below 2015 Targeted ROIC | Payout Score (%) | |||
| +50 | 200 | |||
| 0 | 100 | |||
| -70 | 50 | |||
Less than -70 | 0 | |||
| Basis Points Above or Below 2016 Targeted ROIC | Payout Score (%) | |||
| +100 | 200 | |||
| 0 | 100 | |||
| -150 | 25 | |||
Less than -150 | 0 | |||
| Item | Amount of Adjustment to Company-Wide EBITDA | |||
| Product portfolio optimization | $ | 5,693,000 | ||
| Income related to natural gas contract hedge ineffectiveness | (1,860,000 | ) | ||
| Toledo Plant work stoppage | 4,162,000 | |||
| Executive terminations | 4,460,000 | |||
| Pension settlements | 168,000 | |||
| Total | $ | 12,623,000 | ||
| Adjusted EBITDA Margin | Net Debt to Adjusted EBITDA Ratio | |||||
Percent of Targeted Adjusted EBITDA Margin | Performance Level | Payout Percentage | Percent of Targeted Net Debt to Adjusted EBITDA Ratio | Performance Level | Payout Percentage | |
| 115% | Maximum | 200 | 115% | Maximum | 200 | |
| 100% | Target | 100 | 100% | Target | 100 | |
| 80% | Threshold | 50 | 80% | Threshold | 50 | |
| <80% | Below Threshold | 0 | <80% | Below Threshold | 0 | |
| Final Payout Score as % of Target | ||||
| Adjusted EBITDA Margin | Net Debt to Adjusted EBITDA Ratio | Total | ||
| 80.6% | 68.2% | 74.4% | ||
| Death or Disability | Resignation or Retirement | Termination without Cause | Termination without Cause in connection with Change in Control | |||||
| Cash Severance | None | None | None | None | ||||
Annual Cash Incentive (SMIP)(1) | Prorated and subject to actual performance | Prorated and subject to actual performance | Prorated and subject to actual performance | Prorated and subject to actual performance | ||||
Long-Term Performance Cash Incentive(1) | Prorated target award for any current performance cycle, paid as soon as administratively feasible | Prorated and subject to actual performance | Prorated and subject to actual performance | Not prorated but subject to actual performance | ||||
| Equity Awards Granted in 2016 | All awards immediately vest | All awards immediately vest | All awards immediately vest | All awards immediately vest | ||||
| Equity Awards Granted in 2017 and 2018 | All awards immediately vest | Forfeit all unvested awards | Awards scheduled to vest within one year of termination date will immediately vest | All awards immediately vest | ||||
| Health, Welfare and Other Benefits | Accrued Benefits only | Accrued Benefits only | Accrued Benefits only | Accrued Benefits only | ||||
| (1) | Except in the case of death or permanent disability, amounts paid under our SMIP and the performance cash component of our LTIP will be paid between January 1 and March 15 of the year following the end of the relevant performance cycle. |
| Death or Disability | Termination for Cause or Quit without Good Reason | Quit for Good Reason | Termination without Cause | Termination without Cause or Quit for Good Reason in connection with Change in Control | |||||||
| All Non-CEO NEOs | All Non-CEO NEOs | ||||||||||
Non-CEO NEOs | Mr. Mossing and Ms. Zibbel(1) | Non-CEO NEOs | All Non-CEO NEOs | ||||||||
| Cash Severance | None | ||||||||||
| None | None | Lump sum 2x annual salary + 2x target annual incentive(3) | |||||||||
| Annual Cash Incentive (SMIP) | None | None | None | Prorated and subject to actual performance(2) | |||||||
| Long-Term Performance Cash Incentive | |||||||||||
| Prorated target award for any current performance cycle | None | Prorated and | |||||||||
| subject to actual performance(2) | Prorated and subject to actual performance(2) | Not prorated but subject to actual performance(2) | |||||||||
| Equity Awards | |||||||||||
| Forfeit all unvested awards | Forfeit all unvested awards | Awards scheduled to vest within 1 year immediately vest | All awards immediately vest | ||||||||
| Health, Welfare and Other Benefits | Benefits only | Accrued Benefits only | Accrued Benefits only | Accrued Benefits; continued dental/health benefits during period of salary continuation; outplacement services during period of salary continuation | Accrued Benefits; 18 months continued dental/health/life insurance benefits; outplacement services with cost to Libbey ≤15% base salary; financial planning services with cost to Libbey ≤$10,000 | ||||||
| Conditions to Payment of Benefits | |||||||||||
| None | None | None | |||||||||
| Release of claims against | |||||||||||
| Libbey; Confidentiality | |||||||||||
| obligations; Obligation to assign intellectual property | |||||||||||
| rights; Obligation to assist with | |||||||||||
| Release of claims against | |||||||||||
| Libbey; Confidentiality | |||||||||||
| obligations; Obligation to assign intellectual property | |||||||||||
| rights; Obligation to assist with | |||||||||||
| (1) | The above table assumes a termination date of December 31, 2018. Mr. Mossing and Ms. Zibbel have since become eligible for the same termination benefits as the other non-CEO named executives. |
| (2) | Amounts paid under our SMIP and the performance cash component of our LTIP will be paid between January 1 and March 15 of the year following the end of the relevant performance cycle. |
| Lump-sum cash payments will be paid no later than five days after termination |
Carlos V. Duno, Chair | |
Ginger M. Jones | |
Eileen A. Mallesch | |
Carol B. Moerdyk Steve Nave |
| Executive Compensation Tables |
Name and Principal Position | Year | Salary ($)(1) | Bonus ($)(2) | Stock Awards ($)(3) | Option Awards ($)(4) | Non-Equity Incentive Compensation ($)(5) | Change in Pension Value and Nonqualified Deferred Compensation Earnings ($)(6) | All Other Compensation ($)(7) | Total ($) | |||||||||||||||||
| William A. Foley | 2016 | 804,185 | 0 | 1,037,687 | 532,688 | 801,520 | 0 | 110,050 | 3,286,130 | |||||||||||||||||
| Chairman and Chief | ||||||||||||||||||||||||||
Executive Officer(8) | ||||||||||||||||||||||||||
| Stephanie A. Streeter | 2016 | 21,166 | 0 | 0 | 0 | 653,666 | 0 | 3,301,516 | 3,976,348 | |||||||||||||||||
| Chief Executive | 2015 | 792,438 | 0 | 960,406 | 517,050 | 728,386 | 0 | 73,677 | 3,071,957 | |||||||||||||||||
Officer(9) | 2014 | 768,750 | 0 | 4,436,131 | 413,043 | 941,390 | 0 | 44,259 | 6,603,573 | |||||||||||||||||
| Sherry Buck | 2016 | 482,125 | 0 | 257,312 | 143,125 | 386,211 | 0 | 47,115 | 1,315,888 | |||||||||||||||||
| Vice President, Chief | 2015 | 462,500 | 0 | 245,784 | 132,320 | 221,129 | 0 | 41,651 | 1,103,384 | |||||||||||||||||
Financial Officer(10) | 2014 | 386,907 | 0 | 217,148 | 112,263 | 311,530 | 0 | 35,988 | 1,063,836 | |||||||||||||||||
| Annunciata Cerioli | 2016 | 424,670 | 0 | 185,728 | 103,312 | 214,012 | 0 | 60,679 | 988,401 | |||||||||||||||||
| Vice President, Chief | 2015 | 377,646 | 0 | 244,588 | 77,851 | 86,713 | 0 | 27,435 | 814,233 | |||||||||||||||||
| Supply Chain | 2014 | 29,170 | 252,289 | 246,591 | 70,866 | 13,714 | 0 | 0 | 612,630 | |||||||||||||||||
Officer(11) | ||||||||||||||||||||||||||
| Susan A. Kovach | 2016 | 341,568 | 0 | 123,696 | 68,809 | 209,254 | 21,812 | 34,191 | 799,330 | |||||||||||||||||
| Vice President, | 2015 | 334,070 | 0 | 128,214 | 69,025 | 123,403 | 0 | 24,320 | 679,032 | |||||||||||||||||
| General Counsel & | 2014 | 325,117 | 25,000 | 129,672 | 67,034 | 189,097 | 29,532 | 19,442 | 784,894 | |||||||||||||||||
| Secretary | ||||||||||||||||||||||||||
| Salvador Miñarro | 2016 | 355,291 | 0 | 162,528 | 90,407 | 241,106 | 0 | 98,845 | 948,177 | |||||||||||||||||
| Villalobos | 2015 | 373,902 | 0 | 617,047 | 93,409 | 143,209 | 0 | 71,138 | 1,298,705 | |||||||||||||||||
| Vice President, | ||||||||||||||||||||||||||
| General Manager | ||||||||||||||||||||||||||
U.S. & Canada(12) | ||||||||||||||||||||||||||
| James H. White | 2016 | 131,250 | 0 | 304,720 | 169,491 | 127,004 | 0 | 1,041,734 | 1,774,199 | |||||||||||||||||
| Vice President, Chief | 2015 | 246,591 | 0 | 1,561,933 | 148,879 | 80,949 | 0 | 13,980 | 2,052,332 | |||||||||||||||||
Operating Officer(13) | ||||||||||||||||||||||||||
| Summary Compensation Table |
| Change in Pension Value and Nonqualified Deferred Compensation Earnings | ||||||||||||||||||||||||||
| Non-Equity Incentive Compensation | ||||||||||||||||||||||||||
| Salary | Bonus | Stock Awards | Option Awards | All Other Compensation | Total | |||||||||||||||||||||
| Name and Principal Position | Year | ($) | ($)(1) | ($)(2) | ($)(3) | ($)(4) | ($)(5) | ($)(6) | ($) | |||||||||||||||||
| William A. Foley | 2018 | 825,000 | 0 | 814,353 | 0 | 1,014,805 | 0 | 123,984 | 2,778,142 | |||||||||||||||||
Chairman and Chief Executive Officer(7) | 2017 | 770,000 | 0 | 544,611 | 322,592 | 707,520 | 0 | 120,649 | 2,465,372 | |||||||||||||||||
| 2016 | 804,185 | 0 | 1,037,687 | 532,688 | 801,520 | 0 | 110,050 | 3,286,130 | ||||||||||||||||||
| James C. Burmeister | 2018 | 386,250 | 0 | 123,389 | 0 | 247,598 | 0 | 28,362 | 785,599 | |||||||||||||||||
Senior Vice President, Chief Financial Officer(8) | 2017 | 271,354 | 100,000 | 76,808 | 47,057 | 145,859 | 0 | 25,752 | 666,830 | |||||||||||||||||
| Susan A. Kovach | 2018 | 361,503 | 0 | 110,512 | 0 | 204,799 | 0 | 35,959 | 712,773 | |||||||||||||||||
| Senior Vice President, General Counsel & Secretary | 2017 | 339,189 | 0 | 71,754 | 42,500 | 143,174 | 22,060 | 33,959 | 652,636 | |||||||||||||||||
| 2016 | 341,568 | 0 | 123,696 | 68,809 | 209,254 | 21,812 | 34,191 | 799,330 | ||||||||||||||||||
| Salvador Miñarro Villalobos | 2018 | 15,100 | 0 | 21,450 | 0 | 22,541 | 0 | 641,233 | 700,324 | |||||||||||||||||
Vice President, General Manager, US & Canada(9) | 2017 | 348,978 | 0 | 94,283 | 55,844 | 165,014 | 0 | 77,171 | 741,290 | |||||||||||||||||
| 2016 | 355,291 | 0 | 162,528 | 90,407 | 241,106 | 0 | 98,845 | 948,177 | ||||||||||||||||||
| William C. Mossing | 2018 | 300,000 | 0 | 69,095 | 0 | 141,474 | 0 | 103,391 | 613,960 | |||||||||||||||||
Senior Vice President, Chief Supply Chain Officer(10) | ||||||||||||||||||||||||||
| Sarah J. Zibbel | 2018 | 228,626 | 100,000 | 120,170 | 0 | 107,538 | 0 | 22,304 | 578,638 | |||||||||||||||||
Senior Vice President, Chief Human Resources Officer(11) | ||||||||||||||||||||||||||
| (1) | As to Mr. |
| (2) |
Represents the grant date fair value, in accordance with FASB ASC Topic 718, with respect to RSUs granted in |
| (3) | Represents the grant date fair value, in accordance with FASB ASC Topic 718, with respect to NQSOs granted in 2017 and 2016, respectively. The awards vest ratably over a four-year period from the date of grant or, in Mr. Burmeister's case, from the first day of employment. When Mr. Miñarro’s employment ended on January 15, 2018, vesting was accelerated with respect to all NQSOs that otherwise would have vested by January 15, 2019, and all other unvested NQSOs were forfeited. For more information, see Footnote 11, “Employee Stock Benefit Plans,” to the consolidated financial statements included in our Annual Report on Form 10-K filed with the SEC on February 27, 2019. The actual values received by the respective named executives depend on the number of NQSOs that actually vest, the number of shares with respect to which NQSOs are exercised and the price of our common stock on the date on which the NQSOs are exercised. |
| Represents |
| Represents the actuarial increase in pension value under our Salary Plan and our SERP. In |
| For |
| Named Executive | EDCP Matching Contribution ($)(a) | Tax Prep / Financial Planning ($)(b) | Housing Allowance or Relocation Assistance ($)(c) | Tax Gross-Up ($)(d) | Ground Transport ($)(e) | Airline Club Membership ($) | Annual Executive Physical Exam ($) | Legal Fees ($)(f) | Vacation ($)(g) | Total ($) | ||||||||||||||||||||
| W. Foley | 30,938 | 11,699 | 49,416 | 2,185 | 1,365 | 495 | 2,739 | 0 | 0 | 98,837 | ||||||||||||||||||||
| S. Streeter | 0 | 537 | 0 | 0 | 109 | 0 | 0 | 0 | 0 | 646 | ||||||||||||||||||||
| S. Buck | 12,113 | 14,000 | 0 | 0 | 1,036 | 479 | 0 | 0 | 3,587 | 31,215 | ||||||||||||||||||||
| A. Cerioli | 8,800 | 13,772 | 13,551 | 7,949 | 707 | 0 | 0 | 0 | 0 | 44,779 | ||||||||||||||||||||
| S. Kovach | 4,291 | 14,000 | 0 | 0 | 0 | 0 | 0 | 0 | 0 | 18,291 | ||||||||||||||||||||
| S. Miñarro | 0 | 3,255 | 51,192 | 10,195 | 342 | 0 | 0 | 23,126 | 0 | 88,110 | ||||||||||||||||||||
| J. White | 0 | 0 | 0 | 0 | 1,569 | 0 | 0 | 0 | 0 | 1,569 | ||||||||||||||||||||
| EDCP Matching Contribution | Tax Prep / Financial Planning | Housing Allowance, Commuting or Relocation Assistance | Tax Gross-Up | Ground Transport | Airline Club Membership | Annual Executive Physical Exam | Total | |||||||||
| Named Executive | ($)(a) | ($)(b) | ($)(c) | ($)(d) | ($)(e) | ($) | ($) | ($) | ||||||||
| W. Foley | 33,000 | 14,760 | 51,568 | 2,996 | 2,332 | 495 | 2,933 | 108,084 | ||||||||
| J. Burmeister | 0 | 8,761 | 0 | 0 | 163 | 495 | 2,443 | 11,862 | ||||||||
| S. Kovach | 4,552 | 14,760 | 0 | 0 | 261 | 0 | 0 | 19,573 | ||||||||
| S. Miñarro | 0 | 592 | 0 | 0 | 0 | 0 | 0 | 592 | ||||||||
| W. Mossing | 0 | 12,658 | 59,463 | 13,980 | 424 | 495 | 2,121 | 89,141 | ||||||||
| S. Zibbel | 0 | 9,948 | 0 | 0 | 1,506 | 0 | 0 | 11,454 | ||||||||
| (a) | Annual company matching contributions to our EDCP |
| (b) | The cost we paid for tax return preparation and financial planning for the respective named executives |
| (c) | As to Mr. Foley, represents |
| (d) | As to Mr. Foley, |
| (e) | Includes our incremental cost for ground transportation for personal and business trips from the Toledo, Ohio, area to the Detroit / Wayne County Metropolitan Airport. For personal trips, includes the entire cost that we incurred for such transportation. For business trips, includes the amount in excess of the amount to which the respective named executives would have been entitled as reimbursement for mileage and parking under our travel policy applicable to all employees. |
| Mr. Foley assumed his role as CEO effective January 12, 2016. Effective March 24, 2019, he retired from his role as CEO but continues to be employed by the Company as Executive Chairman. |
| (8) | Mr. Burmeister was hired on March 30, 2017. |
| (9) |
| (10) |
| (11) | Ms. |
Estimated Possible Payouts under Non-Equity Incentive Plan Awards(2) | All Other Stock Awards: Number of Shares of Stock or Units (#)(3) | All Other Option Awards: Number of Securities Underlying Options (#)(4) | Exercise or Base Price of Option Awards ($/Sh) | Grant Date Fair Value of Stock and Option Awards ($)(5) | |||||||||||||||||||||||
Named Executive | Plan Name | Award Date(1) | Grant Date(1) | Threshold ($) | Target ($) | Maximum ($) | |||||||||||||||||||||
| W. Foley | 2016 SMIP | 1/11/2016 | 165,000 | 825,000 | 1,856,250 | ||||||||||||||||||||||
| 2016 LTIP (cash) | 1/11/2016 | 247,500 | 990,000 | 1,980,000 | |||||||||||||||||||||||
| 2015 LTIP (cash) | 1/11/2016 | 326,700 | 653,400 | 1,306,800 | |||||||||||||||||||||||
| 2014 LTIP (cash) | 1/11/2016 | 81,675 | 326,700 | 653,400 | |||||||||||||||||||||||
| 2016 LTIP (RSUs) | 1/11/2016 | 2/25/2016 | 59,855 | 957,680 | |||||||||||||||||||||||
| 2016 LTIP (NQSOs) | 1/11/2016 | 2/25/2016 | 126,598 | 17.13 | 532,688 | ||||||||||||||||||||||
| 2016 Omnibus Plan | 10/28/2014 | 5/10/2016 | 4,551 | 80,007 | |||||||||||||||||||||||
| S. Streeter | 2016 SMIP | 1/11/2016 | 24,057 | ||||||||||||||||||||||||
| 2016 LTIP (cash) | 1/11/2016 | 9,623 | |||||||||||||||||||||||||
| S. Buck | 2016 SMIP | 2/8/2016 | 67,498 | 337,488 | 759,348 | ||||||||||||||||||||||
| 2016 LTIP (cash) | 2/8/2016 | 66,500 | 266,000 | 532,000 | |||||||||||||||||||||||
| 2016 LTIP (RSUs) | 2/8/2016 | 2/25/2016 | 16,082 | 257,312 | |||||||||||||||||||||||
| 2016 LTIP (NQSOs) | 2/8/2016 | 2/25/2016 | 34,015 | 17.13 | 143,125 | ||||||||||||||||||||||
| A. Cerioli | 2016 SMIP | 2/8/2016 | 48,720 | 243,601 | 548,102 | ||||||||||||||||||||||
| 2016 LTIP (cash) | 2/8/2016 | 48,000 | 192,001 | 384,002 | |||||||||||||||||||||||
| 2016 LTIP (RSUs) | 2/8/2016 | 2/25/2016 | 11,608 | 185,728 | |||||||||||||||||||||||
| 2016 LTIP (NQSOs) | 2/8/2016 | 2/25/2016 | 24,553 | 17.13 | 103,312 | ||||||||||||||||||||||
| S. Kovach | 2016 SMIP | 2/8/2016 | 34,157 | 170,784 | 384,264 | ||||||||||||||||||||||
| 2016 LTIP (cash) | 2/8/2016 | 31,970 | 127,878 | 255,756 | |||||||||||||||||||||||
| 2016 LTIP (RSUs) | 2/8/2016 | 2/25/2016 | 7,731 | 123,696 | |||||||||||||||||||||||
| 2016 LTIP (NQSOs) | 2/8/2016 | 2/25/2016 | 16,353 | 17.13 | 68,809 | ||||||||||||||||||||||
| S. Miñarro | 2016 SMIP | 2/8/2016 | 42,635 | 213,175 | 479,644 | ||||||||||||||||||||||
| 2016 LTIP (cash) | 2/8/2016 | 42,005 | 168,019 | 336,038 | |||||||||||||||||||||||
| 2016 LTIP (RSUs) | 2/8/2016 | 2/25/2016 | 10,158 | 162,528 | |||||||||||||||||||||||
| 2016 LTIP (NQSOs) | 2/8/2016 | 2/25/2016 | 21,486 | 17.13 | 90,407 | ||||||||||||||||||||||
| J. White | 2016 SMIP | 2/8/2016 | 79,931 | 399,656 | 899,226 | ||||||||||||||||||||||
| 2016 LTIP (cash) | 2/8/2016 | 78,750 | 315,000 | 630,000 | |||||||||||||||||||||||
| 2016 LTIP (RSUs) | 2/8/2016 | 2/25/2016 | 19,045 | 304,720 | |||||||||||||||||||||||
| 2016 LTIP (NQSOs) | 2/8/2016 | 2/25/2016 | 40,281 | 17.13 | 169,491 | ||||||||||||||||||||||
| Grants of Plan-Based Awards Table |
Estimated Possible Payouts under Non-Equity Incentive Plan Awards(2) | All Other Stock Awards: Number of Shares of Stock or Units | Grant Date Fair Value of Stock and Option Awards | |||||||||||||||||||
| Named Executive | Plan Name | Award Date(1) | Grant Date(1) | Threshold | Target | Maximum | |||||||||||||||
| ($) | ($) | ($) | (#)(3) | ($)(4) | |||||||||||||||||
| W. Foley | 2018 SMIP | 2/15/18 | 41,250 | 825,000 | 1,650,000 | ||||||||||||||||
| 2018 LTIP (cash) | 2/15/18 | 618,750 | 1,237,500 | 2,475,000 | |||||||||||||||||
| 2018 LTIP (RSU) | 2/6/18 | 2/28/18 | 159,677 | 814,353 | |||||||||||||||||
| J. Burmeister | 2018 SMIP | 2/15/18 | 11,588 | 231,750 | 463,500 | ||||||||||||||||
| 2018 LTIP (cash) | 2/15/18 | 93,750 | 187,500 | 375,000 | |||||||||||||||||
| 2018 LTIP (RSU) | 2/6/18 | 2/28/18 | 24,194 | 123,389 | |||||||||||||||||
| S. Kovach | 2018 SMIP | 2/15/18 | 9,038 | 180,752 | 361,504 | ||||||||||||||||
| 2018 LTIP (cash) | 2/15/18 | 83,968 | 167,936 | 335,872 | |||||||||||||||||
| 2018 LTIP (RSU) | 2/6/18 | 2/28/18 | 21,669 | 110,512 | |||||||||||||||||
| S. Miñarro | Omnibus Plan (RSU) | 1/9/18 | 1/15/18 | 3,000 | 21,450 | ||||||||||||||||
| W. Mossing | 2018 SMIP | 2/15/18 | 7,500 | 150,000 | 300,000 | ||||||||||||||||
| 2018 LTIP (cash) | 2/15/18 | 52,500 | 105,000 | 210,000 | |||||||||||||||||
| 2018 LTIP (RSU) | 2/6/18 | 2/28/18 | 13,548 | 69,095 | |||||||||||||||||
| S. Zibbel | 2018 SMIP | 3/7/18 | 5,716 | 114,313 | 228,626 | ||||||||||||||||
| 2018 LTIP (cash) | 3/7/18 | 49,729 | 99,458 | 198,916 | |||||||||||||||||
| 2018 LTIP (RSU) | 3/7/18 | 5/2/18 | 14,000 | 71,470 | |||||||||||||||||
| Omnibus Plan (RSU) | 3/7/18 | 5/2/18 | 10,000 | 48,700 | |||||||||||||||||
| (1) | For |
| (2) | Represents the range, as estimated on the award date, of possible cash awards under (a) our |
| (a) | Under our SMIP, each named executive is eligible for an annual incentive award in an amount up to |
Target Award as a Percentage of Anticipated Full-Year Base Salary | ||
| Named Executive | ||
| W. Foley | ||
| S. Kovach | ||
| W. Mossing | 50% | |
| S. | ||
| Revenue Growth (Net Sales) | Adjusted Cash Earnings | |||||||
Full Year Net Sales | Percent of Targeted Net Sales | Performance Level | Payout Percentage | Full Year Cash Earnings | Percent of Targeted Cash Earnings | Performance Level | Payout Percentage | |
| $880,000 | 104.9% | Maximum | 200% | $131,076 | 110.0% | Maximum | 200% | |
| $839,138 | 100.0% | Target | 100% | $119,160 | 100.0% | Target | 100% | |
| $800,000 | 95.3% | Threshold | 40% | $95,328 | 80.0% | Threshold | 50% | |
| < $800,000 | < 95.3% | Below Threshold | 0% | < $95,328 | < 80.0% | Below Threshold | 0% | |
| (b) | Under the performance cash component of our |
| Named Executive | 2016 Target Long-Term Award as a Percentage of Annualized Base Salary (%) | 2016 LTIP Performance Cash Target as Percentage of Annualized Base Salary (%) | ||
| W. Foley | 300 | 120 | ||
| S. Streeter | 300 | 120 | ||
| S. Buck | 140 | 56 | ||
| A. Cerioli | 120 | 48 | ||
| S. Kovach | 95 | 38 | ||
| S. Miñarro | 120 | 48 | ||
| J. White | 150 | 60 | ||
| 2018 Target Long-Term Award as a Percentage of Annualized Base Salary | 2018 LTIP Performance Cash Target as a Percentage of Annualized Base Salary | |||
| Named Executive | ||||
| W. Foley | 300% | 150% | ||
| J. Burmeister | 100% | 50% | ||
| S. Kovach | 95% | 48% | ||
| W. Mossing | 70% | 35% | ||
| S. Zibbel | 70% | 32% | ||
| Basis Points Above or Below 2016 Targeted ROIC | Payout Score (%) | |||
| +100 | 200 | |||
| 0 | 100 | |||
| -150 | 25 | |||
Less than -150 | 0 | |||
| Percent of 2018 Targeted Adjusted EBITDA | Payout Score | |
| 112.5% | 200% | |
| 0 | 100% | |
| 87.5% | 50% | |
| Less than 87.5% | 0% | |
| (3) | Represents grants of RSUs made under our |
| (4) |
| Option Awards | Stock Awards | ||||||||||||||||||||
| Named Executive | Award Date(1) | Grant Date(1)(2) | Number of Securities Underlying Unexercised Options (#) Exercisable | Number of Securities Underlying Unexercised Options (#) Unexercisable(3) | Option Exercise Price ($) | Option Expiration Date | Number of Shares or Units of Stock That Have Not Vested (#)(3)(4) | Market Value of Shares or Units of Stock That Have Not Vested ($)(5) | |||||||||||||
| W. Foley | 1/11/2016 | 2/25/2016 | 0 | 126,598 | 17.13 | 2/25/2026 | 59,855 | 1,164,778 | |||||||||||||
S. Streeter(6) | 12/9/2013 | 12/16/2013 | 240,829 | 0 | 21.29 | 1/11/2017 | |||||||||||||||
S. Buck(7) | 7/6/2012 | 8/1/2012 | 33,389 | 0 | 13.96 | 3/31/2017 | 0 | 0 | |||||||||||||
| 2/11/2013 | 2/22/2013 | 8,953 | 0 | 19.02 | 2/22/2023 | 0 | 0 | ||||||||||||||
| 2/17/2014 | 2/24/2014 | 5,370 | 0 | 23.02 | 2/24/2024 | 0 | 0 | ||||||||||||||
| 2/16/2015 | 3/2/2015 | 2,246 | 0 | 38.06 | 3/31/2017 | 0 | 0 | ||||||||||||||
| A. Cerioli | 10/27/2014 | 12/1/2014 | 2,746 | 2,745 | 29.50 | 12/1/2024 | 4,178 | 81,304 | |||||||||||||
| 2/16/2015 | 3/2/2015 | 1,321 | 3,963 | 38.06 | 3/2/2025 | 2,934 | 57,096 | ||||||||||||||
| 6/11/2015 | 6/12/2015 | 1,875 | 36,488 | ||||||||||||||||||
| 2/8/2016 | 2/25/2016 | 0 | 24,553 | 17.13 | 2/25/2026 | 11,608 | 225,892 | ||||||||||||||
| S. Kovach | 2/4/2008 | 2/15/2008 | 3,621 | 0 | 15.35 | 2/15/2018 | |||||||||||||||
| 2/7/2011 | 2/10/2011 | 3,625 | 0 | 17.00 | 2/10/2021 | ||||||||||||||||
| 2/6/2012 | 2/17/2012 | 4,624 | 0 | 13.95 | 2/17/2022 | ||||||||||||||||
| 2/11/2013 | 2/22/2013 | 5,177 | 1,725 | 19.02 | 2/22/2023 | 1,513 | 29,443 | ||||||||||||||
| 2/17/2014 | 2/24/2014 | 3,207 | 3,206 | 23.02 | 2/24/2024 | 2,817 | 54,819 | ||||||||||||||
| 2/16/2015 | 3/2/2015 | 1,172 | 3,513 | 38.06 | 3/2/2025 | 2,601 | 50,615 | ||||||||||||||
| 2/8/2016 | 2/25/2016 | 0 | 16,353 | 17.13 | 2/25/2026 | 7,731 | 150,445 | ||||||||||||||
| S. Miñarro | 2/4/2008 | 2/15/2008 | 3,200 | 0 | 15.35 | 2/15/2018 | |||||||||||||||
| 2/9/2009 | 2/27/2009 | 3,500 | 0 | 1.01 | 2/27/2019 | ||||||||||||||||
| 2/8/2010 | 2/11/2010 | 6,000 | 0 | 10.13 | 2/11/2020 | ||||||||||||||||
| 12/6/2010 | 12/31/2010 | 20,000 | 0 | 15.47 | 12/31/2020 | ||||||||||||||||
| 2/7/2011 | 2/10/2011 | 7,000 | 0 | 17.00 | 2/10/2021 | ||||||||||||||||
| 2/6/2012 | 2/17/2012 | 7,500 | 0 | 13.95 | 2/17/2022 | ||||||||||||||||
| 7/5/2012 | 8/1/2012 | 3,597 | 0 | 13.96 | 8/1/2022 | ||||||||||||||||
| 2/11/2013 | 2/22/2013 | 5,939 | 1,979 | 19.02 | 2/22/2023 | 1,734 | 33,744 | ||||||||||||||
| 2/17/2014 | 2/24/2014 | 3,291 | 3,291 | 23.02 | 2/24/2024 | 2,891 | 56,259 | ||||||||||||||
| 2/16/2015 | 3/2/2015 | 1,585 | 4,755 | 38.06 | 3/2/2025 | 12,521 | 243,659 | ||||||||||||||
| 2/8/2016 | 2/25/2016 | 0 | 21,486 | 17.13 | 2/25/2026 | 10,158 | 197,675 | ||||||||||||||
J. White(8) | |||||||||||||||||||||
| Outstanding Equity Awards at Fiscal Year-End |
| Option Awards | Stock Awards | ||||||||||||||||||||
| Named Executive | Award Date(1) | Grant Date(1)(2) | Number of Securities Underlying Unexercised Options (#) Exercisable | Number of Securities Underlying Unexercised Options (#) Unexercisable(3) | Option Exercise Price ($) | Option Expiration Date | Number of Shares or Units of Stock That Have Not Vested (#)(4) | Market Value of Shares or Units of Stock That Have Not Vested ($)(5) | |||||||||||||
| W. Foley | 1/11/16 | 2/25/16 | 63,299 | 63,299 | 17.13 | 2/25/26 | 29,927 | 116,117 | |||||||||||||
| 2/13/17 | 3/1/17 | 22,138 | 66,412 | 13.60 | 3/1/27 | 32,834 | 127,396 | ||||||||||||||
| 2/5/18 | 2/28/18 | 159,677 | 619,547 | ||||||||||||||||||
| J. Burmeister | 3/16/17 | 5/3/17 | 5,297 | 15,889 | 9.38 | 5/3/27 | 7,008 | 27,191 | |||||||||||||
| 2/5/18 | 2/28/18 | 24,194 | 93,873 | ||||||||||||||||||
| S. Kovach | 2/7/11 | 2/10/11 | 3,625 | 0 | 17.00 | 2/10/21 | |||||||||||||||
| 2/6/12 | 2/17/12 | 4,624 | 0 | 13.95 | 2/17/22 | ||||||||||||||||
| 2/11/13 | 2/22/13 | 6,902 | 0 | 19.02 | 2/22/23 | ||||||||||||||||
| 2/17/14 | 2/24/14 | 6,413 | 0 | 23.02 | 2/24/24 | ||||||||||||||||
| 2/16/15 | 3/2/15 | 3,514 | 1,171 | 38.06 | 3/2/25 | 867 | 3,364 | ||||||||||||||
| 2/8/16 | 2/25/16 | 8,177 | 8,176 | 17.13 | 2/25/26 | 3,865 | 14,996 | ||||||||||||||
| 2/13/17 | 3/1/17 | 2,917 | 8,749 | 13.60 | 3/1/27 | 4,326 | 16,785 | ||||||||||||||
| 2/5/18 | 2/28/18 | 21,669 | 84,076 | ||||||||||||||||||
| S. Miñarro | 2/8/10 | 2/11/10 | 6,000 | 0 | 10.13 | 2/11/20 | |||||||||||||||
| W. Mossing | 11/5/17 | 12/1/17 | 7,531 | 22,592 | 6.75 | 12/1/27 | 6,682 | 25,926 | |||||||||||||
| 11/5/17 | 12/1/17 | 14,000 | 54,320 | ||||||||||||||||||
| 2/5/18 | 2/28/18 | 13,548 | 52,566 | ||||||||||||||||||
| S. Zibbel | 3/7/18 | 5/2/18 | 14,000 | 54,320 | |||||||||||||||||
| 3/7/18 | 5/2/18 | 10,000 | 38,800 | ||||||||||||||||||
| (1) | The Award Date is the date on which the Compensation Committee took action, and the Grant Date is the date on which we determined the number of NQSOs or RSUs, as the case may be, awarded. |
| (2) | See |
| (3) | Represents NQSOs awarded under our |
| (4) | Represents RSUs awarded under our |
| (5) | Represents the market value, as of December 31, |
| Option Awards | Stock Awards | |||||||||||
| Named Executive | Number of Shares Acquired on Exercise (#) | Value Realized on Exercise ($)(1) | Number of Shares Acquired on Vesting ($)(2) | Value Realized on Vesting ($)(3) | ||||||||
| W. Foley | 0 | 0 | 4,551 | 80,007 | ||||||||
| S. Streeter | 54,801 | 129,731 | 150,029 | 2,937,568 | ||||||||
| S. Buck | 0 | 0 | 11,747 | 212,777 | ||||||||
| A. Cerioli | 0 | 0 | 3,693 | 66,863 | ||||||||
| S. Kovach | 0 | 0 | 5,586 | 96,832 | ||||||||
| S. Miñarro | 2,882 | 21,846 | 8,584 | 149,804 | ||||||||
| J. White | 10,071 | 9,265 | 15,564 | 289,490 | ||||||||
| Option Exercises and Stock Vested in Fiscal 2018 |
| Option Awards | Stock Awards | |||||||||||
| Named Executive | Number of Shares Acquired on Exercise (#) | Value Realized on Exercise ($)(1) | Number of Shares Acquired on Vesting ($)(2) | Value Realized on Vesting ($)(3) | ||||||||
| W. Foley | 0 | 0 | 25,909 | 157,268 | ||||||||
| J. Burmeister | 0 | 0 | 2,336 | 11,423 | ||||||||
| S. Kovach | 0 | 0 | 5,651 | 34,317 | ||||||||
| S. Miñarro | 3,500 | 24,612 | 13,055 | 96,364 | ||||||||
| W. Mossing | 0 | 0 | 2,228 | 13,390 | ||||||||
| S. Zibbel | 0 | 0 | 0 | 0 | ||||||||
| (1) | Represents the sum of the differences between the market prices and the exercise prices for the respective awards of NQSOs exercised by the named |
| (2) |
| (3) |
| Vesting Date | Closing Price ($) | |||
| January 15, 2018 | 7.71 | |||
| February 17, 2018 | 6.07 | |||
| February 24, 2018 | 6.08 | |||
| February 26, 2018 | 6.13 | |||
| March 30, 2018 | 4.89 | |||
| December 1, 2018 | 6.01 | |||
| [(A) × (B) × (C)] + [(D) × (E) × (C)] + [(F) + (A) + (G)] |
| (A) | Monthly final average earnings for the three highest consecutive calendar years before 2008 |
| (B) | 1.212% |
| (C) | Years of credited service up to 35 years |
| (D) | Monthly final average earnings above Social Security Wage base at retirement |
| (E) | 0.176% |
| (F) | 0.5% |
| (G) | Years of credited service over 35 years |
| Named Executive | Plan Name | Number of Years of Credited Service (#)(1) | Present Value of Accumulated Benefit ($)(2) | Payments During Last Fiscal Year ($) | |||||||
| W. Foley | N/A | N/A | N/A | N/A | |||||||
| S. Streeter | N/A | N/A | N/A | N/A | |||||||
| S. Buck | N/A | N/A | N/A | N/A | |||||||
| A. Cerioli | N/A | N/A | N/A | N/A | |||||||
| S. Kovach | Salary Plan | 13.08 | 164,229 | 0 | |||||||
| SERP | 13.08 | 125,254 | 0 | ||||||||
| S. Miñarro | N/A | N/A | N/A | N/A | |||||||
| J. White | N/A | N/A | N/A | N/A | |||||||
| Pension Benefits in Fiscal 2018 Table |
| Named Executive | Plan Name | Number of Years of Credited Service (#)(1) | Present Value of Accumulated Benefit ($)(2) | Payments During Last Fiscal Year ($) | ||||
| S. Kovach | Salary Plan | 15.08 | 172,141 | 0 | ||||
| SERP | 15.08 | 136,694 | 0 | |||||
| (1) | Represents actual years of service to Libbey. The plans were frozen at the end of 2012, after which additional pension service is not credited. |
| (2) | Amounts were determined based on the assumptions outlined in our audited financial statements for the year ended December 31, |
Executive Contributions in Last FY | Registrant Contributions in Last FY | Aggregate Earnings in Last FY | Aggregate Withdrawals / Distributions in Last FY | Aggregate Balance at Last FYE(3) | ||||||||||||||||||||||
| Named Executive | ($) | RSUs | ($)(1) | RSUs | ($)(2) | RSUs | ($) | RSUs | ($) | RSUs | ||||||||||||||||
| W. Foley | 30,938 | 0 | 30,938 | 0 | 6 | 0 | 0 | 0 | 61,881 | 0 | ||||||||||||||||
| S. Streeter | 2,117 | 0 | 0 | 0 | (24,001 | ) | 0 | (388,925 | ) | 0 | 0 | 0 | ||||||||||||||
| S. Buck | 12,113 | 0 | 12,113 | 0 | 2,055 | 131 | 0 | 0 | 83,480 | 5,310 | ||||||||||||||||
| A. Cerioli | 68,800 | 0 | 8,800 | 0 | 1,830 | 0 | 0 | 0 | 79,430 | 0 | ||||||||||||||||
| S. Kovach | 4,291 | 0 | 4,291 | 0 | 1,011 | 407 | 0 | 0 | 69,922 | 16,530 | ||||||||||||||||
| S. Miñarro | 0 | 0 | 0 | 0 | 0 | 0 | 0 | 0 | 0 | 0 | ||||||||||||||||
| J. White | 6,563 | 0 | 0 | 0 | 839 | 0 | (40,696 | ) | 0 | 0 | 0 | |||||||||||||||
| Nonqualified Deferred Compensation in Fiscal 2018 Table |
Executive Contributions in Last FY | Registrant Contributions in Last FY | Aggregate Earnings in Last FY | Aggregate Withdrawals /Distributions in Last FY | Aggregate Balance at Last FYE(3) | |||||||||||||||||
| Named Executive | ($) | RSUs | ($)(1) | RSUs | ($)(2) | RSUs | ($) | RSUs | ($) | RSUs | |||||||||||
| W. Foley | 33,000 | 0 | 33,000 | 0 | 2,051 | 0 | 0 | 0 | 189,686 | 0 | |||||||||||
| J. Burmeister | 0 | 0 | 0 | 0 | 0 | 0 | 0 | 0 | 0 | 0 | |||||||||||
| S. Kovach | 4,552 | 0 | 4,552 | 0 | (5,402 | ) | 286 | 0 | 0 | 77,624 | 17,720 | ||||||||||
| S. Miñarro | 0 | 0 | 0 | 0 | 0 | 0 | 0 | 0 | 0 | 0 | |||||||||||
| W. Mossing | 0 | 0 | 0 | 0 | 0 | 0 | 0 | 0 | 0 | 0 | |||||||||||
| S. Zibbel | 0 | 0 | 0 | 0 | 0 | 0 | 0 | 0 | 0 | 0 | |||||||||||
| (1) | The following amounts are Kovach - $4,552. |
| (2) | Not included in the Summary Compensation Table because earnings are not at an above-market rate. |
| (3) | Of the total amounts in this column, the following amounts are reported as |
| Named Executive | Salary ($) | Stock Awards ($) | ||||
| W. Foley | 30,938 | 0 | ||||
| S. Streeter | 381,251 | 0 | ||||
| S. Buck | 35,288 | 0 | ||||
| A. Cerioli | 68,800 | 0 | ||||
| S. Kovach | 10,923 | 0 | ||||
| S. Miñarro | 0 | 0 | ||||
| J. White | 28,875 | 0 | ||||
| Named Executive | Salary ($) | Stock Awards ($) | ||
| W. Foley | 93,638 | 0 | ||
| S. Kovach | 12,202 | 0 | ||
Potential Payments Upon Termination of Employment(1) |
| Named Executive | Cash Severance ($) | Annual Incentive for Year of Termination ($) | LTIP Cash ($)(2) | Acceleration of Unvested Equity Awards ($)(3) | Misc. Benefits ($) | Total ($) | ||||||||||||
| William A. Foley | ||||||||||||||||||
Death or permanent disability(4) | 0 | 556,000 | 980,100 | 1,459,752 | 0 | 2,995,852 | ||||||||||||
Voluntary termination(5) | 0 | 556,000 | 759,550 | 0 | 0 | 1,315,550 | ||||||||||||
Involuntary termination without Cause - no change in control(6) | 0 | 556,000 | 759,550 | 364,944 | 0 | 1,680,494 | ||||||||||||
Involuntary termination without Cause in connection with a change in control(7) | 0 | 556,000 | 1,459,854 | 1,459,752 | 0 | 3,475,606 | ||||||||||||
| Involuntary termination for Cause | 0 | 0 | 0 | 0 | 0 | 0 | ||||||||||||
| Stephanie A. Streeter | ||||||||||||||||||
Involuntary termination without Cause - no change in control(8) | 3,193,000 | 24,057 | 629,609 | 2,978,115 | 106,618 | 6,931,399 | ||||||||||||
| Sherry Buck | ||||||||||||||||||
Voluntary termination without Good Reason - no change in control(9) | 0 | 0 | 0 | 0 | 0 | 0 | ||||||||||||
| Annunciata Cerioli | ||||||||||||||||||
Death or permanent disability(10) | 0 | 141,670 | 254,404 | 457,987 | 0 | 854,061 | ||||||||||||
Voluntary termination for Good Reason - no change in control(11) | 0 | 0 | 176,576 | 0 | 0 | 176,576 | ||||||||||||
Involuntary termination without Cause - no change in control(12) | 704,006 | 141,670 | 176,576 | 142,623 | 93,393 | 1,258,268 | ||||||||||||
Voluntary termination for Good Reason or involuntary termination without Cause - change in control(13) | 1,408,012 | 141,670 | 314,631 | 457,987 | 106,507 | 2,428,807 | ||||||||||||
| Involuntary termination for Cause | 0 | 0 | 0 | 0 | 0 | 0 | ||||||||||||
| Susan A. Kovach | ||||||||||||||||||
Death or permanent disability(10) | 0 | 118,695 | 247,101 | 324,184 | 0 | 689,980 | ||||||||||||
Retirement(14) | 0 | 118,695 | 0 | 0 | 289,483 | 408,178 | ||||||||||||
Voluntary termination for Good Reason - no change in control(11) | 0 | 0 | 170,540 | 0 | 0 | 170,540 | ||||||||||||
Involuntary termination without Cause - no change in control(12) | 514,875 | 118,695 | 170,540 | 121,617 | 88,454 | 1,014,181 | ||||||||||||
Voluntary termination for Good Reason or involuntary termination without Cause - change in control(13) | 1,029,750 | 118,695 | 267,688 | 324,184 | 84,585 | 1,824,902 | ||||||||||||
| Involuntary termination for Cause | 0 | 0 | 0 | 0 | 0 | 0 | ||||||||||||
| Salvador Miñarro Villalobos | ||||||||||||||||||
Death or permanent disability(10) | 0 | 148,156 | 292,952 | 582,269 | 0 | 1,023,377 | ||||||||||||
Voluntary termination for Good Reason – no change in control(11) | 0 | 0 | 199,709 | 0 | 0 | 199,709 | ||||||||||||
Involuntary termination without Cause -- no change in control(12) | 571,266 | 148,156 | 199,709 | 205,905 | 93,393 | 1,218,429 | ||||||||||||
Voluntary termination for Good Reason or involuntary termination without Cause - change in control(13) | 1,142,532 | 148,156 | 328,177 | 582,269 | 94,062 | 2,295,196 | ||||||||||||
| Involuntary termination for Cause | 0 | 0 | 0 | 0 | 0 | 0 | ||||||||||||
| James H. White | ||||||||||||||||||
Involuntary termination without Cause -- no change in control(11) | 918,750 | 68,414 | 93,209 | 324,295 | 93,808 | 1,498,476 | ||||||||||||
| Named Executive | Event | Cash Severance ($) | Annual Incentive for Year of Termination ($) | LTIP Cash ($)(2) | Acceleration of Unvested Equity Awards ($)(3) | Misc. Benefits ($) | Total ($) | ||||||||
| W. Foley | Death or permanent disability(4) | 0 | 819,775 | 2,227,124 | 863,059 | 0 | 3,909,958 | ||||||||
Voluntary resignation(5) | 0 | 819,775 | 744,779 | 116,117 | 0 | 1,680,671 | |||||||||
Termination without Cause - no change in control(6) | 0 | 819,775 | 744,779 | 313,473 | 0 | 1,878,027 | |||||||||
Termination without Cause - change in control(7) | 0 | 819,775 | 1,432,530 | 863,059 | 0 | 3,115,364 | |||||||||
| Termination for Cause | 0 | 0 | 0 | 0 | 0 | 0 | |||||||||
| J. Burmeister | Death or permanent disability(4) | 0 | 230,282 | 260,275 | 121,064 | 0 | 611,621 | ||||||||
Quit for Good Reason - no change in control(8) | 0 | 0 | 95,589 | 0 | 0 | 95,589 | |||||||||
Termination without Cause - no change in control(9) | 624,000 | 230,282 | 95,589 | 32,534 | 86,557 | 1,068,962 | |||||||||
Quit for Good Reason or termination without Cause - change in control(10) | 1,248,000 | 230,282 | 199,793 | 121,064 | 88,751 | 1,887,890 | |||||||||
| Termination for Cause | 0 | 0 | 0 | 0 | 0 | 0 | |||||||||
| S. Kovach | Death or permanent disability(4) | 0 | 179,607 | 292,501 | 119,221 | 0 | 591,329 | ||||||||
Retirement(11) | 0 | 179,607 | 0 | 0 | 308,835 | 488,442 | |||||||||
Quit for Good Reason - no change in control(8) | 0 | 0 | 98,709 | 0 | 0 | 98,709 | |||||||||
Termination without Cause - no change in control(9) | 546,231 | 179,607 | 98,709 | 37,481 | 88,220 | 950,248 | |||||||||
Quit for Good Reason or Termination without Cause - change in control(10) | 1,092,462 | 179,607 | 191,497 | 119,221 | 87,370 | 1,670,157 | |||||||||
| Termination for Cause | 0 | 0 | 0 | 0 | 0 | 0 | |||||||||
| S. Miñarro | Termination without Cause — no change in control(12) | 579,835 | 0 | 22,541 | 190,342 | 93,219 | 885,937 | ||||||||
| W. Mossing | Death or permanent disability(4) | 0 | 135,500 | 103,270 | 132,812 | 0 | 371,582 | ||||||||
Quit for Good Reason – no change in control(8) | 0 | 0 | 41,956 | 0 | 0 | 41,956 | |||||||||
Termination without Cause — no change in control(13) | 225,000 | 135,500 | 41,956 | 21,786 | 84,248 | 508,490 | |||||||||
Quit for Good Reason or termination without Cause - change in control(10) | 900,000 | 135,500 | 100,298 | 132,812 | 85,659 | 1,354,269 | |||||||||
| Termination for Cause | 0 | 0 | 0 | 0 | 0 | 0 | |||||||||
| S. Zibbel | Death or permanent disability(4) | 0 | 103,263 | 75,950 | 93,120 | 0 | 272,333 | ||||||||
Quit for Good Reason - no change in control(8) | 0 | 0 | 31,400 | 0 | 0 | 31,400 | |||||||||
Termination without Cause - no change in control(14) | 155,001 | 103,263 | 31,400 | 13,580 | 46,148 | 349,392 | |||||||||
Quit for Good Reason or termination without Cause - change in control(10) | 930,006 | 103,263 | 91,677 | 93,120 | 85,359 | 1,303,425 | |||||||||
| Termination for Cause | 0 | 0 | 0 | 0 | 0 | 0 | |||||||||
| (1) | Represents potential payments pursuant to equity award agreements, |
| (2) | As to those triggering events for which we estimated future payouts under the performance cash component of our |
| (3) | For those triggering events that result in acceleration of unvested equity awards: (a) except as to RSUs |
| (4) | Represents the sum of: |
| (a) | under |
| (b) | under |
| (c) | under |
| (5) | Represents the sum of: |
| (a) | under |
| (b) | under |
| (c) | under "Acceleration of Unvested Equity Awards," the |
| (6) | Represents the sum of: |
| (a) | under |
| (b) | under |
| (c) | under "Acceleration of Unvested Equity Awards," the sum |
| (7) | Represents the sum of: |
| under |
| under |
| under |
| (8) |
| (a) | under |
| (b) | under |
| (c) | under |
| (d) | under "Acceleration of Unvested Equity Awards," the sum of: (i) the estimated value, as of December 31, 2018, of common stock underlying RSUs that were unvested as of December 31, 2018, but were scheduled to vest by December 31, 2019,; (ii) the in-the-money/ intrinsic value, as of December 31, 2018, of NQSOs that were unvested as of December 31, 2018, but were scheduled to vest by December 31, 2019; and |
| (e) | under “Misc. Benefits,” the sum of (i) the estimated cost (net of contributions by the named executive at the active employee rate) of continued medical, dental, and prescription drug coverage for 12 months following termination; and (iii) executive outplacement services for a period of one year from termination at the rate of $75,000 per year. |
| (9) | Represents the sum of: |
| (a) | under “Cash Severance,” the sum of 6 months' base salary and 50% of Mr. Burmeister's target award under our 2017 SMIP, at the annual base salary and target incentive opportunity in effect on the date of termination; |
| (b) | under “Annual Incentive for Year of Termination,” the amount actually earned under our 2017 SMIP; |
| (c) | under “LTIP Cash,” the sum of the amount actually earned under the performance cash component of our 2015 LTIP and prorated actual awards under the performance cash component of each of our 2016 LTIP and our 2017 LTIP [estimated as described in footnote (2) above]; |
| (d) | under "Acceleration of Unvested Equity Awards," the sum of: (i) the estimated value, as of December 31, 2017, of common stock underlying RSUs that were unvested as of December 31, 2017, but were scheduled to vest by December 31, 2018,; (ii) the in-the-money/intrinsic value, as of December 31, 2017, of NQSOs that were unvested as of December 31, 2017, but were scheduled to vest by December 31, 2018; and |
| (e) | under “Misc. Benefits,” the sum of (i) the estimated cost (net of contributions by the named executive at the active employee rate) of continued medical, dental, and prescription drug coverage for six months following termination; and (iii) executive outplacement services for a period of one year from termination at the rate of $75,000 per year. |
| (10) | Represents the sum of: |
| (a) | under “Cash Severance,” the sum of two times the named executive’s annual base salary and two times the named executive’s target award under our 2018 SMIP, at the annual base salary and target incentive opportunity in effect on the date of termination; |
| (b) | under “Annual Incentive for Year of Termination,” the amount actually earned under our 2018 SMIP; |
| (c) | under “LTIP Cash,” the sum of the amount actually earned under the performance cash component of our 2016 LTIP and an estimate (without proration) of the amount the named executive would earn under the performance cash component of each of our |
| (d) | under |
| (e) | under |
| Represents the sum of: |
| (a) | under |
| (b) | under |
| (12) | Represents the sum of: |
| (a) | under “Cash Severance,” salary continuation for 12 months and a lump sum payment; |
| (b) | under “LTIP Cash,” the sum of the amount actually earned under the performance cash component of our 2016 LTIP and prorated actual awards under the performance cash component of our 2017 LTIP [estimated as described in footnote (2) above]; |
| (c) | under "Acceleration of Unvested Equity Awards," the sum of: (i) the estimated value, as of January 15, 2018, of common stock underlying RSUs that were unvested as of January 15, 2018, but were scheduled to vest by January 15, 2019; (ii) the estimated value, as of January 15, 2018, of common stock underlying 3,000 RSUs that were unvested as of January 15, 2018, but for which the Committee exercised discretion to accelerate vesting; and (iii) the in-the-money/intrinsic value, as of January 15, 2018, of NQSOs that were unvested as of January 15, 2018, but were scheduled to vest by January 15, 2019; and |
| (d) | under “Misc. Benefits,” the sum of (i) the estimated cost (net of contributions by the named executive at the active employee rate) of continued medical, dental, and prescription drug coverage for 12 months following termination; and (iii) executive outplacement services for a period of one year from termination at the rate of $75,000 per year. |
| (13) | Represents the sum of: |
| (a) | under “Cash Severance,” the sum of 6 months' base salary and 50% of Mr. Mossing's target award under our 2018 SMIP, at the annual base salary and target incentive opportunity in effect on the date of termination; |
| (b) | under “Annual Incentive for Year of Termination,” the amount actually earned under our 2018 SMIP; |
| (c) | under “LTIP Cash,” the sum of the amount actually earned under the performance cash component of our 2016 LTIP and prorated actual awards under the performance cash component of each of our 2017 LTIP and our 2018 LTIP [estimated as described in footnote (2) above]; |
| (d) | under "Acceleration of Unvested Equity Awards," the sum of: (i) the estimated value, as of December 31, 2018, of common stock underlying RSUs that were unvested as of December 31, 2018, but were scheduled to vest by December 31, 2019,; (ii) the in-the-money/intrinsic value, as of December 31, 2018, of NQSOs that were unvested as of December 31, 2018, but were scheduled to vest by December 31, 2019; and |
| (e) | under “Misc. Benefits,” the sum of (i) the estimated cost (net of contributions by the named executive at the active employee rate) of continued medical, dental, and prescription drug coverage for six months following termination; and (iii) and executive outplacement services for a period of one year from termination at the rate of $75,000 per year. |
| (14) | Represents the sum of: |
| (a) | under “Cash Severance,” 6 months' base salary; |
| (b) | under “Annual Incentive for Year of Termination,” the amount actually earned under our 2018 SMIP; |
| (c) | under “LTIP Cash,” the sum of the amount actually earned under the performance cash component of our 2016 LTIP and prorated actual awards under the performance cash component of each of our 2017 LTIP and our 2018 LTIP [estimated as described in footnote (2) above]; |
| (d) | under "Acceleration of Unvested Equity Awards," the sum of: (i) the estimated value, as of December 31, 2018, of common stock underlying RSUs that were unvested as of December 31, 2018, but were scheduled to vest by December 31, 2019; and |
| (e) | under “Misc. Benefits,” the sum of (i) the estimated cost (net of contributions by the named executive at the active employee rate) of continued medical, dental, and prescription drug coverage for six months following termination; and (iii) and executive outplacement services for a period of six months from termination at the rate of $75,000 per year. |
| CEO Pay Ratio |
| Based on this information for 2018, the ratio of the annual total compensation of Mr. Foley, our CEO, to the median of the annual total compensation of all employees was: | 204 | : | 1 | |
| • | With respect to the annual total compensation of our CEO, we used the amount reported in the “Total” column of our 2018 Summary Compensation Table included in this Proxy Statement. |
| Name and Address of Beneficial Owner | Amount and Nature of Beneficial Ownership | Percent of Class | |||
Brigade Capital Management, LP(1) 399 Park Avenue, 16th Floor New York, NY 10022 | 2,410,000 | 10.8 | % | ||
Russell Investments Group, Ltd.(2) 1301 Second Avenue Suite 1800 Seattle, WA 98101 | 2,276,045 | 10.2 | % | ||
Frontier Capital Management Co., LLC.(3) 99 Summer Street Boston, MA 02110 | 2,025,898 | 9.1 | % | ||
Royce & Associates, LP(4) 745 Fifth Avenue New York, NY 10151 | 1,648,249 | 7.4 | % | ||
Dimensional Fund Advisors LP(5) Building One 6300 Bee Cave Road Austin, TX 78746 | 1,419,412 | 6.4 | % | ||
Boston Partners(6) One Beacon Street Boston, MA 02108 | 1,238,392 | 5.6 | % | ||
| (1) | Based solely on Amendment No. 1 to Schedule 13G filed with the SEC on December 17, 2018, as of December 12, 2018, Brigade Capital Management, LP, Brigade Capital Management GP, LLC, and Donald E. Morgan, III, have shared voting power and shared dispositive power over 2,410,000 shares and Brigade Leveraged Capital Structures Fund Ltd. has shared voting power and shared dispositive power over 2,290,000 shares. |
| (2) | Based solely on Amendment No. 1 Schedule 13G filed with the SEC on March 15, 2019, as of February 28, 2019, Russell Investments Group, Ltd., a parent holding company, was the beneficial owner of 2,276,045 common shares, with sole dispositive power as to no such shares, shared dispositive power as to all such shares, sole voting power with respect to all common shares, and shared voting power with respect to no common shares. |
| (3) | Based solely on Amendment No. 2 to Schedule 13G filed with the SEC on February 11, 2019, as of December 31, 2018, Frontier Capital Management Co., LLC., an investment adviser, was the beneficial owner of 2,025,898 common shares, with sole dispositive power as to all such shares, shared dispositive power as to no such shares, sole voting power with respect to 901,851 common shares, and shared voting power with respect to no common shares. |
| (4) | Based solely on Amendment No. 1 to Schedule 13G filed with the SEC on January 15, 2019, as of December 31, 2018, Royce & Associates, LP, an investment adviser, was the beneficial owner of 1,648,249 common shares, with sole dispositive power as to all such shares, shared dispositive power as to no such shares, sole voting power with respect to all common shares, and shared voting power with respect to no common shares. |
| (5) | Based solely on Amendment No. 4 to Schedule 13G filed with the SEC on February 8, 2019, as of December 31, 2018, Dimensional Fund Advisors LP, an investment adviser, was the beneficial owner of 1,419,412 common shares, with sole dispositive power as to all such shares, shared dispositive power as to no such shares, sole voting power with respect to 1,342,641 common shares, and shared voting power with respect to no common shares. |
| (6) | Based solely on Amendment No. 5 to Schedule 13G filed with the SEC on February 12, 2019, as of December 31, 2018, Boston Partners, an investment adviser, was the beneficial owner of 1,238,392 common shares, with sole dispositive power as to all such shares, shared dispositive power as to no such shares, sole voting power with respect to 272,710 common shares, and shared voting power with respect to no common shares. |
| Name of Beneficial Owner | Amount and Nature of Beneficial Ownership | Percent of Class | |||
James C. Burmeister(1)(2) | 24,133 | * | |||
Carlos V. Duno(3) | 49,305 | * | |||
William A. Foley(1)(2)(3) | 268,911 | 1.21 | % | ||
Ginger M. Jones(3) | 25,635 | * | |||
Susan A. Kovach(1)(2) | 92,731 | * | |||
Eileen A. Mallesch(3) | 22,412 | * | |||
Deborah G. Miller(3) | 47,284 | * | |||
Salvador Miñarro Villalobos(1)(2)(4) | 39,217 | * | |||
Carol B. Moerdyk(3) | 53,842 | * | |||
William C. Mossing(1)(2) | 11,248 | * | |||
Steve Nave(3) | 11,940 | * | |||
John C. Orr(3) | 42,507 | * | |||
Sarah J. Zibbel(1)(2) | 0 | * | |||
Directors and Executive Officers as a Group(1)(2)(3)(4) | 697,395 | 3.13 | % | ||
| (1) | Does not include shares of our common stock that have vested but are deferred under our Executive Deferred Compensation Plan ("EDCP"). As of March 20, 2019, each of our named executives, and all executive officers as a group, had the following shares of our common stock that are vested but deferred under our EDCP: |
| Named Executive | Number of Deferred Shares | |
| W. Foley | 0 | |
| J. Burmeister | 0 | |
| S. Kovach | 17,720 | |
| S. Miñarro | 0 | |
| W. Mossing | 0 | |
| S. Zibbel | 0 | |
| All executive officers as a group | 17,720 | |
| All executive officers as a group | 1,014 | |
| (2) | Includes the following NQSOs that have been granted to our named executives and all executive officers as a group and that currently are exercisable or will be exercisable on or before May 18, 2019: |
| Named Executive | Exercisable Within 60 Days | |
| W. Foley | 139,225 | |
| J. Burmeister | 10,594 | |
| S. Kovach | 44,348 | |
| S. Miñarro | 6,000 | |
| W. Mossing | 7,531 | |
| S. Zibbel | 0 | |
| All executive officers as a group | 212,669 | |
| (3) | Includes the following shares of our common stock that are deferred by non-management directors under our 2009 Director Deferred Compensation Plan, which we refer to as our Director DCP, and that are payable as shares of our common stock: |
| Name of Director | Number of Deferred Shares | |
| C. Duno | 26,327 | |
W. Foley(a) | 0 | |
| G. Jones | 0 | |
| E. Mallesch | 22,412 | |
| D. Miller | 0 | |
| C. Moerdyk | 0 | |
| S. Nave | 11,940 | |
| J. Orr | 0 | |
| All non-management directors as a group | 60,679 | |
| Director | Fees Earned or Paid in Cash ($)(1) | Stock Awards ($)(2) | Change in Pension Value and Nonqualified Deferred Compensation Earnings ($)(3) | All Other Compensation ($) | Total ($) | ||||||||
| Carlos V. Duno | 72,500 | 80,007 | 0 | 0 | 152,507 | ||||||||
| Peter C. McC. Howell | 16,630 | 80,007 | 0 | 0 | 96,637 | ||||||||
| Ginger M. Jones | 75,000 | 80,007 | 0 | 0 | 155,007 | ||||||||
| Theo Killion | 60,421 | 80,007 | 0 | 0 | 140,428 | ||||||||
| Eileen A. Mallesch | 42,079 | 0 | 0 | 0 | 42,079 | ||||||||
| Deborah G. Miller | 60,693 | 80,007 | 0 | 0 | 140,700 | ||||||||
| Carol B. Moerdyk | 60,000 | 80,007 | 0 | 0 | 140,007 | ||||||||
| John C. Orr | 87,587 | 80,007 | 0 | 0 | 167,594 | ||||||||
| Name of Director | Number of Phantom Shares | |
| C. Duno | 0 | |
W. Foley(a) | 13,126 | |
| G. Jones | 0 | |
| E. Mallesch | 0 | |
| D. Miller | 2,443 | |
| C. Moerdyk | 20,566 | |
| S. Nave | 15,768 | |
| J. Orr | 0 | |
| All non-management directors as a group | 51,903 | |
| (a) | Mr. Foley was a non-management director from 1994 until he assumed the role of CEO on January 12, 2016. |
| (4) | Based on last known information as of date of separation from service. For Mr. Miñarro, that date was January 15, 2018. |
| Named Executive | Number of Unvested RSUs(1) | |
| W. Foley | 346,994 | |
| J. Burmeister | 58,845 | |
| S. Kovach | 47,678 | |
| S. Minarro | 0 | |
| W. Mossing | 46,997 | |
| S. Zibbel | 40,692 | |
| All executive officers as a group | 559,076 | |
| (1) | Of these amounts, 14,963 RSUs with four-year ratable vesting were awarded on January 11, 2016; 1,932 RSUs with four-year ratable vesting were awarded on February 8, 2016; 24,773 RSUs with four-year ratable vesting were awarded on February 13, 2017; 7,008 RSUs with four-year ratable vesting were awarded on March 16, 2017; 11,907 RSUs with four-year ratable vesting were awarded on October 23, 2017; 14,000 RSUs with three-year cliff vesting were awarded on November 5, 2017; 173,797 RSUs with four-year ratable vesting were awarded on February 5, 2018; 14,000 RSUs with four-year ratable vesting were awarded on March 7, 2018; 10,000 RSUs with three-year cliff vesting were awarded on March 7, 2018; 296,534 RSUs with three-year ratable vesting were awarded on February 18, 2019; and 3,692 RSUs with three-year ratable vesting were awarded on March 1, 2019. One share of our common stock will be issued for each vested RSU. Dividends do not accrue on RSUs until they vest. For further information, see “Executive Compensation — Compensation Discussion and Analysis — What pay did Libbey's executives receive for 2018?”and the Outstanding Equity Awards at Fiscal Year-End Table above. |
| Section 16(a) Beneficial Ownership Reporting Compliance |
| Plan Category | Number of Securities to be Issued Upon Exercise of Outstanding Options and Rights(1) | Weighted Average Exercise Price of Outstanding Options and Rights | Number of Securities Remaining Available for Future Issuance Under Equity Compensation Plans | ||||||
| Equity compensation plans approved by security holders | 1,283,501 | 16.82 | 968,232 | ||||||
| Equity compensation plans not approved by security holders | — | — | — | ||||||
| Total | 1,283,501 | 16.82 | 968,232 | ||||||
| (1) | This number includes 692,929 restricted stock units awarded under Libbey's equity compensation plans. |
| PROPOSAL NO. 3 | |
| AMENDED AND RESTATED LIBBEY INC. 2016 OMNIBUS INCENTIVE PLAN | |
| Approval of the Amended and Restated Libbey Inc. 2016 Omnibus Incentive Plan. | þ |
The Board of Directors recommends a vote FOR this proposal. | |
Additional shares are required for Libbey to make continued equity grants as necessary in order to attract and retain key talent. As of March 20, 2019, only 345,903 shares remained available for future grant under our 2006 Plan and Existing 2016 Plan combined, which is lower than our three-year average annual share utilization of 591,643 shares. Unless the proposed increase is approved, Libbey |
Additional shares allow Libbey to structure compensation programs that more closely align pay with performance. In order to conserve shares under our incentive plans and manage our burn rate in light of the |
The ability to grant equity awards helps Libbey conserve cash. If the Amended 2016 Plan is not approved, we may have to reduce the equity component and increase the cash component of our compensation program, which would increase cash compensation expense and use cash that could be better utilized to reduce debt or reinvest in our business. |
| 4. | Additional shares enable Libbey to act on feedback received from shareholders. During our recent shareholder outreach, several of the shareholders with which we spoke provided feedback regarding the use of equity compensation, including a preference that we use performance equity in addition to, or instead of, performance cash, and a suggestion that we consider granting awards of stock options to attract and motivate key talent. If the Amended 2016 Plan is not approved, we will not have sufficient shares to consider acting upon these or any other shareholder suggestions that require additional share availability. |
| 5. | We |
| Total Shares Available | Equity Dilution: Percent of Basic Common Shares Outstanding | ||||
Remaining shares authorized for future awards under the 2006 Omnibus Incentive Plan | 161,810 | 0.7% | |||
| Remaining shares authorized for future awards under the 2016 Plan | 184,093 | 0.8% | |||
| Additional shares requested under Amended 2016 Plan | 1,750,000 | 7.9% | |||
Total shares authorized for future awards after approval of Amended 2016 Plan | 2,095,903 | 9.4% | |||
As of March 20, 2019 (Before CEO Grants) | As of March 25, 2019 (After CEO Grants) | |||
| Outstanding stock options and RSUs + shares available for future awards | 3,909,629 | 4,176,456 | ||
| Common shares outstanding | 22,273,568 | 22,273,568 | ||
| Equity overhang | 17.6% | 18.8% | ||
Outstanding Awards as of December 31, 2018(1) | ||||||||||||
| Stock Options | Unvested RSUs | |||||||||||
| Range of Exercise Prices | # Outstanding | Weighted-Average Exercise Price | Weighted-Average Remaining Life | |||||||||
| $6.75 - $9.38 | 79,256 | 7.75 | 8.7 | |||||||||
| $10.13 - $19.02 | 400,389 | 16.10 | 6.6 | |||||||||
| $21.53 - $28.96 | 95,151 | 23.89 | 5.0 | |||||||||
| $38.06 | 15,776 | 38.06 | 6.2 | |||||||||
| Total | 590,572 | |||||||||||
| 692,929 | ||||||||||||
| FY 2018 | FY 2017 | FY 2016 | 3-Year Average | ||||||||||
| (A) | Stock options granted | 0 | 249,392 | 351,590 | 200,327 | ||||||||
| (B) | Full value awards granted | 596,688 | 278,351 | 298,909 | 391,316 | ||||||||
| (C) | Common shares outstanding at fiscal year end | 22,157,220 | 22,018,010 | 21,864,541 | 22,013,257 | ||||||||
| Burn Rate [(A)+(B))/(C)] | 2.7 | % | 2.4 | % | 3.0 | % | 2.7 | % | |||||
| 6. | The Amended 2016 Plan incorporates best practices. The Amended 2016 Plan reflects equity plan best practices including: |
| ◦ | shares that are withheld from an award or separately surrendered by the participant in payment of the exercise price or in payment of taxes relating to the award; and |
| ◦ | shares that are not issued or delivered as a result of the net settlement of an outstanding stock option or SAR. |
| Existing 2016 Plan | Amended 2016 Plan | |
| Prohibits dividend Equivalents on stock options or SARs; provides that dividend Equivalents granted on performance units and/or performance shares will be deferred and held in escrow or deemed reinvested in additional performance Units and/or performance Shares until achievement of the underlying performance goals and will be paid only to the extent that the underlying performance units and/or performance shares are actually earned | Same as Existing 2016 Plan, but also provides that dividends or dividend equivalents with respect to any award that is subject to vesting conditions or restrictions will be deferred and held in escrow or deemed reinvested in additional shares until all vesting conditions or restrictions relating to the award (or portion of the award to which the dividend or dividend equivalent relates) have been satisfied and will be forfeited if and to the extent | |
| Maximum number of shares that may be granted to | Increases maximum to 200,000 shares | |
| Except with respect to a maximum of | Except with respect to a maximum of 5% of the shares authorized for issuance under the plan, full value awards that vest on the basis of the Participant's continued employment with or service to the Company may not vest before the first anniversary of the date on which the award is approved | |
| Contained provisions that were required for awards to qualify as "performance-based" compensation under Section 162(m) of the Internal Revenue Code. | The qualified performance-based compensation exception of Section 162(m) of the Code was repealed as part of the Tax Cuts and Jobs Act of 2017. We have removed certain provisions that were otherwise required for awards to qualify as performance-based compensation under Section 162(m) prior to its repeal. Despite removing certain 162(m) provisions, the Amended 2016 Plan retains the same individual annual award limits that were in effect under the Existing 2016 Plan. These limits are described in further detail below under "Key Features of the Amended 2016 Plan - Individual Award Limits." | |
| Annual Limit per Participant | ||
| Options | 500,000 Shares | |
| SARs | 500,000 Shares | |
| Restricted Stock or RSUs | 500,000 Shares | |
| Performance Units or Performance Shares | 500,000 Shares, or equal to the value of 500,000 Shares as determined as of the date of payout | |
| Cash-Based Awards and Other Stock-Based Awards | the value of $5,000,000 or 500,000 Shares determined as of the date of payout | |
| Awards to Non-Employee Directors | 20,000 Shares | |
| ◦ | the exercise price (which cannot be less than fair market value), |
| ◦ | whether it is a non-qualified or incentive stock option, |
| ◦ | the terms and conditions for exercise of the option; and |
| ◦ | the duration of the option, although, except for nonqualified options granted to Participants who are not U.S. residents, no option will be exercisable more than 10 years after the date of grant. |
| ◦ | by cash or cash equivalents, |
| ◦ | by shares previously owned by the participant valued at fair market value on the date of exercise, |
| ◦ | by a broker-assisted cashless exercise procedure, |
| ◦ | by a combination of any of the above methods, or |
| ◦ | by any other method approved or accepted by the Committee. |
| ◦ | the base price (which cannot be less than fair market value), |
| ◦ | the terms and conditions for exercise of the SAR; and |
| ◦ | the duration of the SAR, although, except for SARS granted to Participants who are not U.S. residents, no SAR will be exercisable more than ten years after the date of grant. |
| ◦ | The number of committees of the Board on which a director serves, |
| ◦ | Service as chair of a committee of the Board, |
| ◦ | Service as Chair of the Board, and |
| ◦ | First election or appointment to the Board. |
| AMENDED AND RESTATED LIBBEY INC. 2016 OMNIBUS INCENTIVE PLAN | |||||||
| Name and Position | Dollar Value ($) | Number of Shares (#)(1) | |||||
| Carlos V. Duno, Director | 90,000 | 13,846 | |||||
| Ginger M. Jones, Director | 90,000 | 13,846 | |||||
| Eileen A. Mallesch, Director | 90,000 | 13,846 | |||||
| Deborah G. Miller, Director | 90,000 | 13,846 | |||||
| Carol B. Moerdyk, Director | 90,000 | 13,846 | |||||
| Steve Nave, Director | 90,000 | 13,846 | |||||
| John C. Orr, Director | 90,000 | 13,846 | |||||
| All non-employee directors as a group | 630,000 | 96,922 | |||||
PROPOSAL NO. 4 | |
| RATIFICATION OF AUDITORS | |
| The Audit Committee has appointed Deloitte & Touche LLP to serve as our independent auditors for our 2019 fiscal year. Although ratification by the shareholders is not required by law, the Board of Directors believes that you should be given the opportunity to express your views on the subject. Unless otherwise directed, proxies will be voted for ratification. | þ |
The Board of Directors recommends a vote FOR this proposal. | |
| Nature of Fees | 2016 Fees | 2015 Fees | ||||||
Audit Fees(1) | $ | 1,116,444 | $ | 1,112,248 | ||||
Audit-Related Fees(2) | 112,840 | 115,200 | ||||||
Tax Fees(3) | 0 | 33,900 | ||||||
| All Other Fees | 0 | 0 | ||||||
| Total | $ | 1,229,284 | $ | 1,261,348 | ||||
| Nature of Fees | 2018 Fees ($) | 2017 Fees ($) | ||
Audit Fees(1) | 1,163,145 | 1,078,000 | ||
Audit-Related Fees(2) | 99,586 | 125,500 | ||
| Tax Fees | 0 | 0 | ||
| All Other Fees | 0 | 0 | ||
| Total | 1,262,731 | 1,203,500 | ||
| (1) | Audit Fees include fees associated with the annual audit of our internal controls, the annual audit of financial statements, the reviews of our quarterly reports on Form 10-Q and annual report on Form 10-K and statutory audit procedures. |
| (2) | Audit-related fees include fees for audits of our employee benefit plans. |
Ginger M. Jones, Chair |
| Deborah G. Miller |
| John C. Orr |
| Name and Address of Beneficial Owner | Amount and Nature of Beneficial Ownership | Percent of Class | ||||||||
Frontier Capital Management Co., LLC.(1) | ||||||||||
| 99 Summer Street | ||||||||||
| Boston, MA 02110 | 2,164,994 | 9.9% | ||||||||
RBC Global Asset Management (U.S.) Inc.(2) | ||||||||||
| 50 South Sixth Street, Suite 2350 | ||||||||||
| Minneapolis, MN 55402 | 1,889,001 | 8.6% | ||||||||
BlackRock, Inc.(3) | ||||||||||
| 55 East 52nd Street | ||||||||||
| New York, NY 10055 | 1,292,374 | 5.9% | ||||||||
Dimensional Fund Advisors LP(4) | ||||||||||
| Building One | ||||||||||
| 6300 Bee Cave Road | ||||||||||
| Austin, TX 78746 | 1,228,844 | 5.6% | ||||||||
Boston Partners(5) | ||||||||||
| One Beacon Street | ||||||||||
| Boston, MA 02108 | 1,195,143 | 5.5% | ||||||||
The Vanguard Group(6) | ||||||||||
| 100 Vanguard Boulevard | ||||||||||
| Malvern, PA 19355 | 1,103,770 | 5.1% | ||||||||
| Name of Beneficial Owner | Amount and Nature of Beneficial Ownership | Percent of Class | ||||
Sherry Buck(1)(2)(4) | 69,538 | * | ||||
Anunciata (Nucci) Cerioli(1)(2) | 18,116 | * | ||||
Carlos V. Duno(3) | 37,648 | * | ||||
William A. Foley(1)(2)(3) | 89,376 | * | ||||
Ginger M. Jones(3) | 10,599 | * | ||||
Theo Killion(3) | 6,381 | * | ||||
Susan A. Kovach(1)(2) | 50,788 | * | ||||
Eileen A. Mallesch(3) | 0 | * | ||||
Deborah G. Miller(3) | 25,492 | * | ||||
Salvador Miñarro Villalobos(1)(2) | 86,596 | * | ||||
Carol B. Moerdyk(3) | 38,095 | * | ||||
John C. Orr(3) | 29,423 | * | ||||
Stephanie A. Streeter(1)(2)(4) | 109,350 | * | ||||
James H. White(1)(2)(4) | 10,413 | * | ||||
Directors and Executive Officers as a Group(1)(2)(3)(4) | 600,344 | 2.74% | ||||
Board Recommendation | |||||
| 1 | Election of Ginger M. Jones and Eileen A. Mallesch to serve as Class II directors | For, Withhold (as to any | |||
FOReach of Ms. Jones and Ms. Mallesch | |||||
Advisory Say-on-Pay: RESOLVED, that the stockholders of the Company approve, on an advisory and non-binding basis, the compensation of the Company’s named executives, as disclosed in this proxy statement, including the Compensation Discussion and Analysis, compensation tables and narrative discussion, pursuant to Item 402 of Regulation S-K | |||||
FOR | |||||
Amended and Restated Libbey Inc. 2016 Omnibus Incentive Plan: Approval of the Amended and Restated Libbey Inc. 2016 Omnibus Incentive Plan | |||||
FOR | |||||
Ratification of Independent Auditor: Ratification of the appointment of Deloitte & Touche LLP as Libbey’s independent auditors for the 2019 fiscal year | |||||
FOR | |||||
| ( | Vote by telephone: Call toll-free 1-800-690-6903, 24 hours a day, seven days a week, until 11:59 p.m., eastern daylight saving time, on May 14, 2019. Make sure you have your proxy card, notice document or email that you received and follow the simple instructions provided. | |
| : | Vote over the internet: Go to www.proxyvote.com, 24 hours a day, seven days a week, until 11:59 p.m., eastern daylight saving time, on May 14, 2019. Make sure you have available the proxy card, notice document or email that you received and follow the simple instructions provided. | |
| * | Vote by mail: If you received printed copies of the proxy materials by mail, you may mark, date and sign the enclosed proxy card and return it in the postage-paid envelope that was provided to you. You should sign your name exactly as it appears on the proxy card. If you are signing in a representative capacity (for example, as guardian, executor, trustee, custodian, attorney or officer of a corporation), you should indicate your name and title or capacity. | |
 | Vote in person at the annual meeting: Bring the proxy card, notice document or email you received and bring other proof of identification and request a ballot at the meeting. | |
| Election of Ginger M. Jones and Eileen A. Mallesch as Class II directors | Since the election of directors is uncontested, each director must receive the vote of the majority of the votes cast with respect to such director’s election. | |||
| Advisory Say-on-Pay | The affirmative vote of a majority of the shares present in person or represented by proxy at the meeting and entitled to vote on the proposal. | |||
| Amended and Restated Libbey Inc. 2016 Omnibus Incentive Plan | The affirmative vote of a majority of the shares present in person or represented by proxy at the meeting and entitled to vote on the proposal. | |||
| Ratification of Independent Auditors | ||||
majority of the shares present in person or represented by proxy at the meeting and entitled to vote on the proposal. | ||||
| Other Business |
| Solicitation Costs |
| Reports to Shareholders |
| Internet | www.proxyvote.com |
| Telephone | 1-800-579-1639 |
| sendmaterial@proxyvote.com | |

| Year-ended December 31, 2018 | |||||
Adjusted EBITDA(1) | |||||
| Reported net income (loss) (U.S. GAAP) | $ | (7,956 | ) | ||
| Add: Interest expense | 21,979 | ||||
| Add: Provision for income taxes | 10,253 | ||||
| Add: Depreciation and amortization | 44,333 | ||||
| Add: Special item before interest and taxes | |||||
| Fees associated with strategic initiative | 2,341 | ||||
| Reported Adjusted EBITDA (non-GAAP) | 70,950 | ||||
| Impact of currency to reflect results at budgeted exchange rates | 1,516 | ||||
| Adjusted EBITDA at budgeted exchange rates (non-GAAP) | $ | 72,466 | |||
Increase in Trade Working Capital(2) | |||||
| Decrease in accounts receivable - net | $ | (6,020 | ) | ||
| Increase in inventories - net | 4,217 | ||||
| Decrease in accounts payable | 3,510 | ||||
| Increase in Trade Working Capital (non-GAAP) | 1,707 | ||||
| Decrease due to currency | 2,198 | ||||
| Increase in Trade Working Capital at budgeted exchange rates (non-GAAP) | $ | 3,905 | |||
| Adjusted Cash Earnings | |||||
| Adjusted EBITDA at budgeted exchange rates (non-GAAP) | $ | 72,466 | |||
| Increase in Trade Working Capital at budgeted exchange rates (non-GAAP) | (3,905 | ) | |||
| Adjusted Cash Earnings at budgeted exchange rates (non-GAAP) | $ | 68,561 | |||
| (1) | We believe that Adjusted EBITDA, a non-GAAP financial measure, is a useful metric for evaluating our financial performance, as it is a measure that we use internally to assess our performance. For certain limitations and a reconciliation from net income (loss) to Adjusted EBITDA, see the "Non-GAAP Measures" and "Reconciliation of Net Income (Loss) to Adjusted EBITDA" sections included in Part II, Item 6. Selected Financial Data, in our 2018 Annual Report on Form 10-K. |
| (2) | Trade Working Capital, a non-GAAP financial measure, is defined as net accounts receivable plus net inventories less accounts payable. We believe that Trade Working Capital is important supplemental information for investors in evaluating liquidity in that it provides insight into the availability of net current resources to fund our ongoing operations. Trade Working Capital is a measure used by management in internal evaluations of cash availability and operational performance. |
| Article 1. Establishment, Purpose, and Duration | B-3 |
| Article 2. Definitions | B-3 |
| Article 3. Administration | B-6 |
| Article 4. Shares Subject to this Plan and Maximum Awards | B-7 |
| Article 5. Eligibility and Participation | B-8 |
| Article 6. Stock Options | B-8 |
| Article 7. Stock Appreciation Rights | B-9 |
| Article 8. Restricted Stock and Restricted Stock Units | B-10 |
| Article 9. Performance Units/Performance Shares | B-11 |
| Article 10. Cash-Based Awards and Other Stock-Based Awards | B-12 |
| Article 11. Transferability of Awards | B-12 |
| Article 12. Performance Measures | B-12 |
Article 1312. Non-employee Director Awards | B-13 |
Article 1413. Dividends and Dividend Equivalents | B-13 |
Article 1514. Beneficiary Designation | B-14 |
Article 1615. Rights of Participants | B-14 |
Article 1716. Change of Control | B-14 |
Article 1817. Amendment, Modification, Suspension, and Termination | B-15 |
Article 1918. Withholding | B-15 |
Article 2019. Successors | B-15 |
Article 2120. General Provisions | B-15 |
| Year ended December 31, 2016 | ||||||||
| As Reported | For LTIP Incentive Calculations | |||||||
| Revenue | ||||||||
| Reported net sales | $ | 793,420 | $ | 793,420 | ||||
| Adjusted EBITDA | ||||||||
| Reported net income | $ | 10,073 | $ | 10,073 | ||||
| Add: Interest expense | 20,888 | 20,888 | ||||||
| Add: Provision for income taxes | 17,711 | 17,711 | ||||||
| Earnings before interest and income taxes (EBIT) | 48,672 | 48,672 | ||||||
| Add: Depreciation and amortization | 48,486 | 48,486 | ||||||
| Earnings before interest, taxes, depreciation and amortization (EBITDA) | 97,158 | 97,158 | ||||||
| Add: Special items before interest and taxes | ||||||||
| Pension settlement | 168 | 168 | ||||||
| Product portfolio optimization | 5,693 | 5,693 | ||||||
| Work Stoppage | 4,162 | 4,162 | ||||||
| Executive terminations | 4,460 | 4,460 | ||||||
| Derivatives | (1,860 | ) | (1,860 | ) | ||||
| Adjusted EBITDA | $ | 109,781 | $ | 109,781 | ||||
| Adjusted EBITDA margin | ||||||||
| Adjusted EBITDA | $ | 109,781 | $ | 109,781 | ||||
| Net sales | $ | 793,420 | $ | 793,420 | ||||
| Adjusted EBITDA margin | 13.8 | % | 13.8 | % | ||||
| Debt net of cash to Adjusted EBITDA ratio | ||||||||
| Debt | $ | 407,840 | $ | 407,840 | ||||
| Plus: Unamortized discount and finance fees | 4,480 | 4,480 | ||||||
| Gross debt | 412,320 | 412,320 | ||||||
| Cash | 61,011 | 61,011 | ||||||
| Less: Share repurchases below budgeted amount | — | 8,000 | ||||||
| Debt net of Cash | $ | 351,309 | $ | 359,309 | ||||
| Adjusted EBITDA | $ | 109,781 | $ | 109,781 | ||||
| Debt net of cash to adjusted EBITDA ratio | 3.2 | 3.3 | ||||||
| 2.1 | “Affiliate” means any corporation or other entity (including, but not limited to, a partnership or a limited liability company) that is affiliated with the Company through stock or equity ownership, or otherwise, and is designated as an Affiliate for purposes of this Plan by the Committee. For purposes of granting Options or Stock Appreciation Rights, an entity may not be considered an Affiliate if it results in noncompliance with Code Section 409A. |
| Year ended December 31, 2016 | ||||||||
| As Reported | For LTIP Incentive Calculations | |||||||
| Return on Invested Capital (ROIC) | ||||||||
| Defined as: After tax adjusted income from operations (using a 30% tax rate) over ending working capital (accounts receivable-net plus inventory-net, less accounts payable) plus net book value of property, plant and equipment | ||||||||
| Income from operations | $ | 45,310 | $ | 45,310 | ||||
| Add: Adjustments | ||||||||
| Product portfolio optimization charge | 5,693 | 5,693 | ||||||
| Work stoppage | 4,162 | 4,162 | ||||||
| Executive terminations | 4,460 | 3,554 | ||||||
| Pension settlement charges | 168 | — | ||||||
| Mexico tax assessment | — | 1,085 | ||||||
| Adjusted income from operations | 59,793 | 59,804 | ||||||
| Add: Impact of currency to reflect results at budgeted exchange rates | — | 4,574 | ||||||
| Adjusted income from operations at budgeted exchange rates | 59,793 | 64,378 | ||||||
| Factor to apply for taxes | 70 | % | 70 | % | ||||
| After tax adjusted income from operations at budgeted exchange rates | $ | 41,855 | $ | 45,065 | ||||
| Invested capital | ||||||||
| Property, plant and equipment, net | $ | 256,392 | $ | 256,392 | ||||
| Add: Impact of currency to reflect results at budgeted exchange rates | — | 4,174 | ||||||
| Property, plant and equipment, net at budgeted exchange rates | 256,392 | 260,566 | ||||||
| Accounts receivable - net | 85,113 | 85,113 | ||||||
| Inventories - net | 170,009 | 170,009 | ||||||
| Less: Accounts payable | 71,582 | 71,582 | ||||||
| Trade Working Capital | 183,540 | 183,540 | ||||||
| Add: Adjustments | ||||||||
| Inventory impact of work stoppage at Toledo, Ohio plant | — | 2,694 | ||||||
| Inventory impact of product portfolio optimization | — | 5,693 | ||||||
| Adjusted trade working capital | 183,540 | 191,927 | ||||||
| Add: Impact of currency | — | 4,616 | ||||||
| Adjusted trade working capital at budgeted exchange rates | 183,540 | 196,543 | ||||||
| Total adjusted invested capital at budgeted exchange rates | $ | 439,932 | $ | 457,109 | ||||
| ROIC | 9.5 | % | 9.9 | % | ||||
“Annual Award Limit” or “Annual Award Limits” has the meaning set forth in Section 4.3. | |
| 2.3 | “Award” means, individually or collectively, a grant under this Plan of Nonqualified Stock Options, Incentive Stock Options, SARs, Restricted Stock, Restricted Stock Units, Performance Shares, Performance Units, Cash-Based Awardsor Other Stock-Based Awards, in each case subject to the terms of this Plan. |
| 2.4 | “Award Agreement” or “Agreement” means either (i) a written agreement entered into by the Company and a Participant setting forth the terms and provisions applicable to an Award granted under this Plan or (ii) a written statement issued by the Company to a Participant describing the terms and provisions of the Award, including any amendment or modification thereof. The Committee may provide for the use of electronic, internet or other non-paper Award Agreements and the use of electronic, internet or other non-paper means for the acceptance of the Award Agreements and actions under them by a Participant. |
| 2.5 | “Beneficial Owner” or “Beneficial Ownership” has the meaning ascribed to that term in Rule 13d-3 of the General Rules and Regulations under the Exchange Act. |
| 2.6 | “Board” or “Board of Directors” means the Board of Directors of the Company. |
| 2.7 | “Cash-Based Award” means an Award, denominated in cash, granted to a Participant as described in Article 10. |
| 2.8 | “Change in Control” means any of the following events: |
| (a) | Any Person (as defined below) is or becomes the Beneficial Owner, directly or indirectly, of securities of the Company representing thirty percent (30%) or more of the combined voting power of the Company’s then-outstanding securities. For purposes of this Plan, the term “Person” is used as that term is used in Sections 13(d) and 14(d) of the Exchange Act; provided, however, that the term shall not include (i) the Company, any trustee or other fiduciary holding |
| (b) | During any period of two (2) consecutive years beginning after the Effective Date of this Plan, Continuing Directors (excluding any Directors designated by a Person who has entered into an agreement with the Company to effect a transaction described in Sections 2.8(a), (c) or (d)) cease for any reason to constitute at least a majority of the Board; |
| (c) | The consummation of a merger or consolidation of the Company with any other corporation or other entity, unless, after giving effect to the merger or consolidation, the voting securities of the Company outstanding immediately prior to the merger or consolidation continue to represent (either by remaining outstanding or by being converted into voting securities of the surviving entity) more than sixty-six and two-thirds percent (66 2/3%) of the combined voting power of the voting securities of the Company or the surviving entity outstanding immediately after the merger or consolidation; or |
| (d) | Consummation of a plan of complete liquidation of the Company or an agreement for the sale or disposition by the Company of all or substantially all of the Company’s assets. |
| 2.9 | “Code” means the U.S. Internal Revenue Code of 1986, as amended from time to time. For purposes of this Plan, references to sections of the Code shall be deemed to include references to any applicable regulations under the Code and any successor or similar provision. |
| 2.10 | “Committee” means the Compensation Committee of the Board or a subcommittee thereof, or any other committee designated by the Board to administer this Plan. The members of the Committee shall be appointed from time to time by, and shall serve at the discretion of, the Board. If the Committee does not exist or cannot function for any reason, the Board may take any action under the Plan that otherwise would be the responsibility of the Committee. |
| 2.11 | “Company” means Libbey Inc., a Delaware corporation, and any successor thereto as provided in Article 2019. |
| 2.12 | “Continuing Directors” means individuals who both (a) as of the end of the period in question are Directors of the Company or whose election or nomination for election by the Company’s shareholders has been approved by a vote of at least two-thirds (2/3) of the Directors of the Company then in office and (b) either (i) at the beginning of the period in question or (ii) after the beginning but prior to the end of the period in question were Directors of the Company or whose election or nomination for election by the Company’s shareholders was approved by a vote of at least two-thirds (2/3) of the Directors of the Company in office at the beginning of the period. |
| 2.13 | “Covered Employee” means any Employee who is or may become a “Covered Employee,” as defined in Code Section 162(m), and who is designated, either as an individual Employee or class of Employees, by the Committee within the shorter of (i) ninety (90) days after the beginning of the Performance Period or (ii) twenty-five percent (25%) of the Performance Period has elapsed, as a “Covered Employee” under this Plan for the applicable Performance Period. |
| 2.14 | 2.13 “Director” means any individual who is a member of the Board of Directors of the Company. |
| 2.15 | 2.14 “Dividend Equivalent” means a right to receive the equivalent value (in cash or Shares) of dividends paid on common stock, awarded under Article 1413. |
| 2.16 | 2.15 “DRO” means a domestic relations order as defined by the Code or Title I of the Employee Retirement Income Security Act of 1974, as amended, or the rules under such statute. |
| 2.17 | 2.16 “Effective Date” has the meaning set forth in Section 1.1. |
| 2.18 | 2.17 “Employee” means any individual designated as an employee of the Company, its Affiliates and/or its Subsidiaries on the payroll records thereof. |
| 2.19 | 2.18 “Exchange Act” means the Securities Exchange Act of 1934, as amended from time to time, or any successor act thereto. |
| 2.20 | 2.19 “Fair Market Value” or “FMV” means a price that is based on the opening, closing, actual, high, low or average selling prices of a Share reported on the NYSE, NYSE MKTAmerican or other established stock exchange (or exchanges) on the applicable date, the preceding trading day, the next preceding trading day, the next succeeding trading day or an average of trading days, as determined by the Committee in its discretion. Unless the Committee determines otherwise, Fair Market Value shall be deemed to be equal to the closing price of a Share on the applicable date, or if shares were not traded on the applicable date, then on the preceding trading day. If Shares are not publicly traded at the time a determination of their value is required to be made under this Plan, then the determination of their Fair Market Value shall be made by the Committee in such manner as it deems appropriate, provided that, in the case of Options and Stock Appreciation Rights, the determination shall be made in compliance with Code Section 409A. The definition(s) of FMV shall be specified in each |
| 2.21 | 2.20 “Full Value Award” means an Award other than in the form of an ISO, NQSO or SAR. |
| 2.22 | 2.21 “Grant Price” means the price established at the time of grant of an SAR pursuant to Article 7. |
| 2.23 | 2.22 “Incentive Stock Option” or “ISO” means an Option that is granted under Article 6 to an Employee, that is designated as an Incentive Stock Option and that is intended to meet the requirements of Code Section 422 or any successor provision. |
| 2.24 | 2.23 “Insider” means an individual who is, on the relevant date, an officer or Director of the Company, or the Beneficial Owner of more than ten percent (10%) of any class of the Company’s equity securities that are registered pursuant to Section 12 of the Exchange Act, as determined by the Board in accordance with Section 16 of the Exchange Act. |
| 2.25 | 2.24 “Nominating and Governance Committee” means the Nominating and Governance Committee of the Board or a subcommittee thereof, or any other committee designated by the Board to administer the pay of Non-employee Directors pursuant to this Plan. The members of the Committee shall be appointed from time to time by, and shall serve at the discretion of, the Board. If the Nominating and Governance Committee does not exist or cannot function for any reason, the Board may take any action under the Plan that otherwise would be the responsibility of the Nominating and Governance Committee. |
| 2.26 | 2.25 “Non-employee Director” means a Director who is not an Employee. |
| 2.27 | 2.26 “Non-employee Director Award” means any NQSO, SAR or Full Value Award granted, whether singly, in combination, or in tandem, to a Non-employee Director. |
| 2.28 | 2.27 “Nonqualified Stock Option” or “NQSO” means an Option that is not intended to meet the requirements of Code Section 422 or that otherwise does not meet those requirements. |
| 2.29 | 2.28 “NYSE” means the New York Stock Exchange. |
| 2.30 | 2.29 “Option” means an option granted to a Participant to purchase the Company’s Shares, including an Incentive Stock Option or a Nonqualified Stock Option, as described in Article 6. |
| 2.31 | 2.30 “Option Price” means the price at which a Participant may purchase a Share pursuant to an Option. |
| 2.32 | 2.31 “Other Stock-Based Award” means an equity-based or equity-related Award that is not otherwise described by the terms of this Plan and that is granted pursuant to Article 10. |
| 2.33 | 2.32 “Participant” means any eligible individual, as determined in accordance with Article 5, to whom an Award is granted. |
| 2.34 | “Performance-Based Compensation” means compensation under an Award that is intended to satisfy the requirements of Code Section 162(m) for certain performance-based compensation paid to Covered Employees. However, nothing in this Plan shall be construed to mean that an Award that does not satisfy the requirements for performance-based compensation under Code Section 162(m) does not constitute performance-based compensation for other purposes, including Code Section 409A. |
| 2.35 | “Performance Measures” means the measures, as described in Article 12, on which the performance goals are based. Performance Measures must be approved by the Company’s shareholders pursuant to this Plan in order to qualify Awards as Performance-Based Compensation. |
| 2.36 | 2.33 “Performance Period” means the period of time during which the performance goals must be met in order to determine the degree of payout and/or vesting with respect to an Award. |
| 2.37 | 2.34 “Performance Share” means an Award that is granted pursuant to Article 9, is subject to the terms of this Plan and is denominated in Shares, the value of which at the time it is payable is determined as a function of the extent to which the corresponding performance criteria have been achieved. |
| 2.38 | 2.35 “Performance Unit” means an Award that is granted pursuant to Article 9, is subject to the terms of this Plan and is denominated in units, the value of which at the time it is payable is determined as a function of the extent to which corresponding performance criteria have been achieved. |
| 2.39 | 2.36 “Period of Restriction” means the period during which Restricted Stock or Restricted Stock Units are subject to a substantial risk of forfeiture based on the passage of time, the achievement of performance goals or the occurrence of other events as determined by the Committee, in its discretion, as provided in Article 8. |
| 2.40 | 2.37 “Plan” means the Amended and Restated Libbey Inc. 2016 Omnibus Incentive Plan. |
| 2.41 | 2.38 “Plan Year” means the calendar year. |
| 2.42 | 2.39 “Replaced Award” means an Award that is granted under this Plan and as to which vesting will be accelerated upon a Change in Control unless the Participant is provided with a Replacement Award. |
| 2.43 | 2.40 “Replacement Award” means an Award that meets the requirements of Section 17.216.2 and is provided to the Participant to replace a Replaced Award. |
| 2.44 | 2.41 “Restricted Stock” means an Award granted to a Participant pursuant to Article 8. |
| 2.45 | 2.42 “Restricted Stock Unit” means an Award that is granted to a Participant pursuant to Article 8 but as to which no Shares actually are awarded to the Participant on the date of grant. |
| 2.46 | 2.43 “Share” means a share of common stock of the Company, $.01par value per share. |
| 2.47 | “Special Items” means unanticipated or unusual transactions or events that were not foreseen or were foreseen but not included in the Company’s annual operating plan because the occurrence of the event was substantially uncertain at the time the annual operating plan was submitted to the Board. |
| 2.48 | 2.44 “Stock Appreciation Right” or “SAR” means an Award, designated as a SAR, pursuant to the terms of Article 7. |
| 2.49 | 2.45 “Subsidiary” means any corporation or other entity, whether domestic or foreign, in which the Company directly or indirectly owns stock possessing fifty percent (50%) or more of the total combined voting power of all classes of stock. |
| 2.50 | 2.46 “Substitute Award” means an Award that, in connection with a corporate transaction such as a merger, combination, consolidation or acquisition of property or stock, is granted under this Plan upon the assumption by the Company of, or in substitution by the Company for, an outstanding equity award previously granted by another company or entity to the corporate transaction; provided, however, that in no event shall the term “Substitute Award” be construed to refer to an Award made in connection with the cancellation and repricing of an Option or SAR. |
| 2.51 | 2.47 “Termination of Employment” means the time when the employee-employer relationship between a Participant and the Company or any Subsidiary is terminated for any reason, with or without cause. Termination of Employment includes, but is not limited to, termination by resignation, discharge, death, disability or retirement, but excludes, at the discretion of the Committee, (a) termination where there is a simultaneous reemployment or continuing employment of a Participant by the Company or any Subsidiary, (b) termination that results in temporary severance of the employee-employer relationship, and (c) termination where there is simultaneous establishment of a consulting relationship by the Company or a Subsidiary with a former Employee. The Committee, in its absolute discretion, shall determine the effect of all matters and questions relating to Termination of Employment, including, without limitation, the question of whether a Termination of Employment resulted from a discharge for good cause, and all questions of whether a particular leave of absence constitutes a Termination of Employment; provided, however, that, with respect to Incentive Stock Options, unless otherwise determined by the Committee in its discretion, a leave of absence, change in status from an Employee to an independent contractor, or other change in the employee-employer relationship shall constitute a Termination of Employment if and to the extent that the leave of absence, change in status or other change interrupts employment for the purposes of Section 422(a)(2) of the Code and the then applicable regulations and revenue rulings under that Section of the Code. |
| (a) | There is hereby reserved for issuance under the Plan an aggregate of one million two hundred thousand (1,200,000)one million nine hundred thirty-four thousand ninety-three (1,934,093) Shares of Libbey Inc. common stock. |
| (b) | The maximum number of Shares that may be issued pursuant to ISOs under this Plan shall be one million two hundred thousand (1,200,000)one million nine hundred thirty-four thousand ninety-three (1,934,093) Shares. |
| (c) | The maximum number of Shares that may be granted to Non-employee Directors collectively in any Plan Year shall be 150,000200,000 Shares, and no Non-employee Director may receive Awards subject to more than 20,000 Shares in any Plan Year. |
| (d) | Except with respect to a maximum of five percent (5%) of the shares authorized for issuance under this Plan, and subject to Section 3.3 above, any Full Value Awards that vest on the basis of the Participant’s continued employment with or service to the Company shall not provide for vesting that is any more rapid than annual pro rata vesting over a three- (3) year period, with the first vesting date occurring no earlier thanprior to the first anniversary of the date on which such Awards are approved, and any Full Value Awards that vest upon the attainment of performance goals shall provide for a performance period of at least twelve (12) months. Subject to Section 3.3 above, Awards of SARs and/or Options that vest on the basis of the Participant’s continued employment with or service to the Company shall not provide for vesting prior to the first anniversary of the date on which such Awards are approved. |
| (a) | Options: The maximum aggregate number of Shares subject to Options granted in any one Plan Year to any one Participant shall be five hundred thousand (500,000). |
| (b) | SARs: The maximum number of Shares subject to Stock Appreciation Rights granted in any one Plan Year to any one Participant shall be five hundred thousand (500,000). |
| (c) | Restricted Stock or Restricted Stock Units: The maximum aggregate grant with respect to Awards of Restricted Stock or Restricted Stock Units in any one Plan Year to any one Participant shall be five hundred thousand (500,000) Shares. |
| (d) | Performance Units or Performance Shares: The maximum aggregate Award of Performance Units or Performance Shares that a Participant may receive in any one Plan Year shall be five hundred thousand (500,000) Shares, or equal to the value of five hundred thousand (500,000) Shares determined as of the date of payout. |
| (e) | Cash-Based Awards and Other Stock-Based Awards: The maximum aggregate amount awarded or credited with respect to Cash-Based or Other Stock-Based Awards to any one Participant in any one Plan Year may not exceed the value of five million dollars ($5,000,000) or five hundred thousand (500,000) Shares determined as of the date of payout. |
| Year ended December 31, 2016 | ||||||||
| As Reported | For SMIP Incentive Calculations | |||||||
| Revenue | ||||||||
| Reported net sales | $ | 793,420 | $ | 793,420 | ||||
| Add: Sales impact of work stoppage at Toledo, Ohio plant | — | 7,245 | ||||||
| Adjusted net sales | 793,420 | 800,665 | ||||||
| Add: Impact of currency to reflect results at budgeted exchange rates | — | 6,263 | ||||||
| Adjusted net sales at budgeted exchange rates | $ | 793,420 | $ | 806,928 | ||||
| Adjusted EBITDA | ||||||||
| Reported net income | $ | 10,073 | $ | 10,073 | ||||
| Add: Interest expense | 20,888 | 20,888 | ||||||
| Add: Provision for income taxes | 17,711 | 17,711 | ||||||
| Earnings before interest and income taxes (EBIT) | 48,672 | 48,672 | ||||||
| Add: Depreciation and amortization | 48,486 | 48,486 | ||||||
| Earnings before interest, taxes, depreciation and amortization (EBITDA) | 97,158 | 97,158 | ||||||
| Add: Special items before interest and taxes | ||||||||
| Pension settlement | 168 | — | ||||||
| Product portfolio optimization | 5,693 | 5,693 | ||||||
| Work Stoppage | 4,162 | 4,162 | ||||||
| Executive terminations | 4,460 | 3,554 | ||||||
| Derivatives | (1,860 | ) | (1,860 | ) | ||||
| 2010 Mexican tax assessment | — | 1,085 | ||||||
| Adjusted EBITDA | 109,781 | 109,792 | ||||||
| Add: Impact of currency to reflect results at budgeted exchange rates | — | 4,609 | ||||||
| Adjusted EBITDA at budgeted exchange rates | 109,781 | 114,401 | ||||||
| Change in Trade Working Capital | ||||||||
| Change in accounts receivable - net | $ | 9,266 | $ | 9,266 | ||||
| Change in inventories - net | 8,018 | 8,018 | ||||||
| Change in accounts payable | 22 | 22 | ||||||
| Change in trade working capital | 17,306 | 17,306 | ||||||
| Add: Adjustments | ||||||||
| Inventory impact of work stoppage at Toledo, Ohio plant | — | (2,694 | ) | |||||
| Inventory impact of product portfolio optimization | — | (5,693 | ) | |||||
| Adjusted change in trade working capital | 17,306 | 8,919 | ||||||
| Add: Impact of currency | — | 4,616 | ||||||
| Adjusted change in trade working capital at budgeted exchange rates | $ | 17,306 | $ | 4,303 | ||||
| Adjusted Cash Earnings | ||||||||
| Adjusted EBITDA at budgeted exchange rates | $ | 109,781 | $ | 114,401 | ||||
| Adjusted change in trade working capital at budgeted exchange rates | 17,306 | 4,303 | ||||||
| Adjusted cash earnings at budgeted exchange rates | $ | 127,087 | $ | 118,704 | ||||
| (a) | Net earnings or net income (before or after taxes); |
| (b) | Earnings per share; |
| (c) | Net sales or revenue growth; |
| (d) | Net operating profit; |
| (e) | Return measures (including, but not limited to, return on assets, capital, invested capital, equity, sales or revenue); |
| (f) | Cash flow (including, but not limited to, operating cash flow, free cash flow, cash flow return on equity and cash flow return on investment); |
| (g) | Earnings before or after taxes, interest, depreciation and/or amortization; |
| (h) | Gross or operating margins; |
| (i) | Productivity ratios; |
| (j) | Share price (including, but not limited to, growth measures and total shareholder return); |
| (k) | Expense targets; |
| (l) | Cost reductions or savings; |
| (m) | Performance against operating budget goals; |
| (n) | Margins; |
| (o) | Operating efficiency; |
| (p) | Funds from operations; |
| (q) | Market share; |
| (r) | Customer satisfaction; |
| (s) | Working capital targets; and |
| (t) | Economic value added or EVA® (net operating profit after tax minus the sum of capital multiplied by the cost of capital). |
| (a) | all then-outstanding Options and SARs shall become fully vested and exercisable immediately; |
| (b) | all other Awards that are not then vested and as to which vesting depends upon only the satisfaction of a service obligation by a Participant to the Company, Subsidiary or Affiliate shall vest in full and be free of restrictions related to the vesting of the Awards; and |
| (c) | All then-outstanding Performance Units, Performance Shares, Other Cash-Based Awards and Other Stock Based Awards that vest upon the attainment of Performance Measuresgoals shall be prorated as of the date of the Change |
| (a) | The Committee may specify in an Award Agreement that the Participant’s rights, payments and benefits with respect to an Award shall be subject to reduction, cancellation, forfeiture or recoupment upon the occurrence of certain specified events, in addition to any otherwise applicable vesting or performance conditions of an Award. These events may include, but shall not be limited to, termination of employment for cause, termination of the Participant’s provision of services to the Company, Affiliate and/or Subsidiary, violation of material Company, Affiliate and/or Subsidiary policies, breach of noncompetition, confidentiality or other restrictive covenants that may apply to the Participant, or other conduct by the Participant that is detrimental to the business or reputation of the Company, its Affiliates and/or its Subsidiaries. |
| (b) | Notwithstanding any provision in this Plan or any Award agreement to the contrary, Awards will be subject, to the extent applicable, to: (i) the terms and conditions of the Company’s recoupment policy (as previously adopted, and as may be amended and restated from time to time); and (b) the Dodd-Frank Wall Street Reform and Consumer Protection Act, as amended (the “Dodd Frank Act”), the Sarbanes-Oxley Act of 2002, as amended, and rules, regulations and binding, published guidance thereunder, and any similar legislation that may be enacted subsequent to the date hereof (including any rules, regulations and binding, published guidance thereunder). Without limiting the generality of the foregoing, the Company may, in its sole discretion, implement any recoupment policies or make any changes to the Company’s existing recoupment policies as the Company deems necessary or advisable in order to company with applicable law or regulatory guidance (including, without limitation, the Dodd-Frank Act). |
| (a) | Obtaining any approvals from governmental agencies that the Company determines are necessary or advisable; and |
| (b) | Completion of any registration or other qualification of the Shares under any applicable national or foreign law or ruling of any governmental body that the Company determines to be necessary or advisable. |
| (a) | Determine which Affiliates and Subsidiaries shall be covered by this Plan; |
| (b) | Determine which Employees and/or Directors outside the United States are eligible to participate in this Plan; |
| (c) | Modify the terms and conditions of any Award granted to Employees and/or Directors outside the United States to comply with applicable foreign laws; |
| (d) | Establish subplans and modify exercise procedures and other terms and procedures, to the extent the actions may be necessary or advisable. Any sub-plans and modifications to Plan terms and procedures established under this Section 2120.9 by the Committee shall be attached to this Plan document as appendices; and |
| (e) | Take any action, before or after an Award is made, that it deems advisable to obtain approval or comply with any necessary local government regulatory exemptions or approvals. |
 | VOTE BY INTERNET - www.proxyvote.com Use the Internet to transmit your voting instructions and for electronic delivery of Electronic Delivery of Future PROXY MATERIALS If you would like to reduce the costs incurred by our company in mailing proxy materials, you can consent to receiving all future proxy statements, proxy cards and annual reports electronically via e-mail or the Internet. To sign up for electronic delivery, please follow the instructions above to vote using the Internet and, when prompted, indicate that you agree to receive or access proxy materials electronically in future years. VOTE BY PHONE - 1-800-690-6903 Use any touch-tone telephone to transmit your voting VOTE BY MAIL Mark, sign and date your proxy card and return it in the postage-paid envelope we have provided or return it to Vote Processing, c/o Broadridge, 51 Mercedes Way, Edgewood, NY 11717. | |||
LIBBEY INC. P.O. BOX 10060 TOLEDO, OH 43699-0060 | ||||
| TO VOTE, MARK BLOCKS BELOW IN BLUE OR BLACK INK AS FOLLOWS: | KEEP THIS PORTION FOR YOUR RECORDS | |
| DETACH AND RETURN THIS PORTION ONLY | ||
| THIS PROXY CARD IS VALID ONLY WHEN SIGNED AND DATED. | ||
For All | Withhold All | For All Except | To withhold authority to vote for any individual nominee(s), mark “For All Except” and write the number(s) of the nominee(s) on the line below. | |||||||||||||||
| The Board of Directors recommends you vote FOR the following Class | ||||||||||||||||||
| 1. | Election of Directors | o | o | o | ||||||||||||||
| Nominees | ||||||||||||||||||
| 01 | ||||||||||||||||||
| Mallesch | ||||||||||||||||||
| The Board of Directors recommends you vote FOR | For | Against | Abstain | |||||||||||||||
2. | Approve, on an advisory and non-binding basis, the 2018 compensation of the Company’s named executives. | o | o | o | ||||||||||||||
| 3. | Approve the Amended and Restated Libbey Inc. 2016 Omnibus Incentive Plan. | o | o | o | ||||||||||||||
4. | Ratification of the appointment of Deloitte & Touche LLP as Libbey’s independent auditors for the | o | o | o | ||||||||||||||
NOTE: The Directors up for election are Class II directors. At the meeting shareholders will transact such other business as properly may come before the meeting. | ||||||||||||||||||
| Please sign exactly as your name(s) appear(s) hereon. When signing as attorney, executor, administrator, or other fiduciary, please give full title as such. Joint owners should each sign personally. All holders must sign. If a corporation or partnership, please sign in full corporate or partnership name, by authorized officer. | ||||||||||||||||||
| Signature [PLEASE SIGN WITHIN BOX] | Date | Signature (Joint Owners) | Date | |||||||||||||||
Important Notice Regarding the Availability of Proxy Materials for the Annual Meeting: The Annual Report and Notice & Proxy Statement are available at www.proxyvote.com. | |||
LIBBEY INC. Annual Meeting of Shareholders May This proxy is solicited by the Board of Directors The shareholder(s) hereby appoint(s) This proxy, when properly executed, will be voted in the manner directed herein. If no such direction is made, this proxy will be voted in accordance with the Board of Directors’ recommendations. | |||
| Continued and to be signed on reverse side | |||